House Sale Prediction Using GCP's Vertex AI
Table of Contents
Google Cloud just released Vertex AI a few days ago, which is their managed/unified machine learning platform. I started digging into it as soon as it was announced, as it is a very powerful platform that caters to several different groups and skill levels. I felt it would be useful to train and deploy a simple model, showcasing some of Vertex AI’s features.
What Is Vertex AI?
Vertex AI’s goal is to be a unified platform for machine learning and artificial intelligence. For those who are familiar with Azure Machine Learning, this is Google’s answer to Azure ML. However, with that said, it also brings some additional features and further streamlines some of the benefits to a hosted environment, which we’ll discuss in a bit.
Vertex AI Features
A quick glance at the Vertex AI dashboard hits some of the key features, including some hot topics such as:
- Labeling services (using Google’s labeler workforce)
- Built-in Jupyter Notebooks
- Training Pipelines
- Model Repository
- Deployment Pipelines
- Container Endpoints
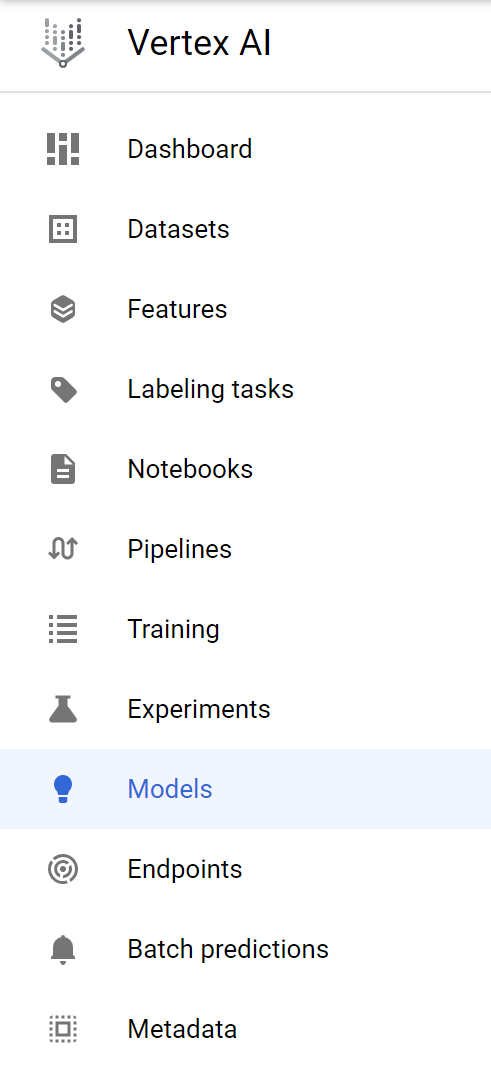
This does’t cover everything, but as you read through the list you can see how Vertex AI’s goal is to stitch together all the ML and MLops components into a single UI. Let’s dive in to building, deploying, and testing a simple model!
Preparing a Linear Regression Model on Vertex AI
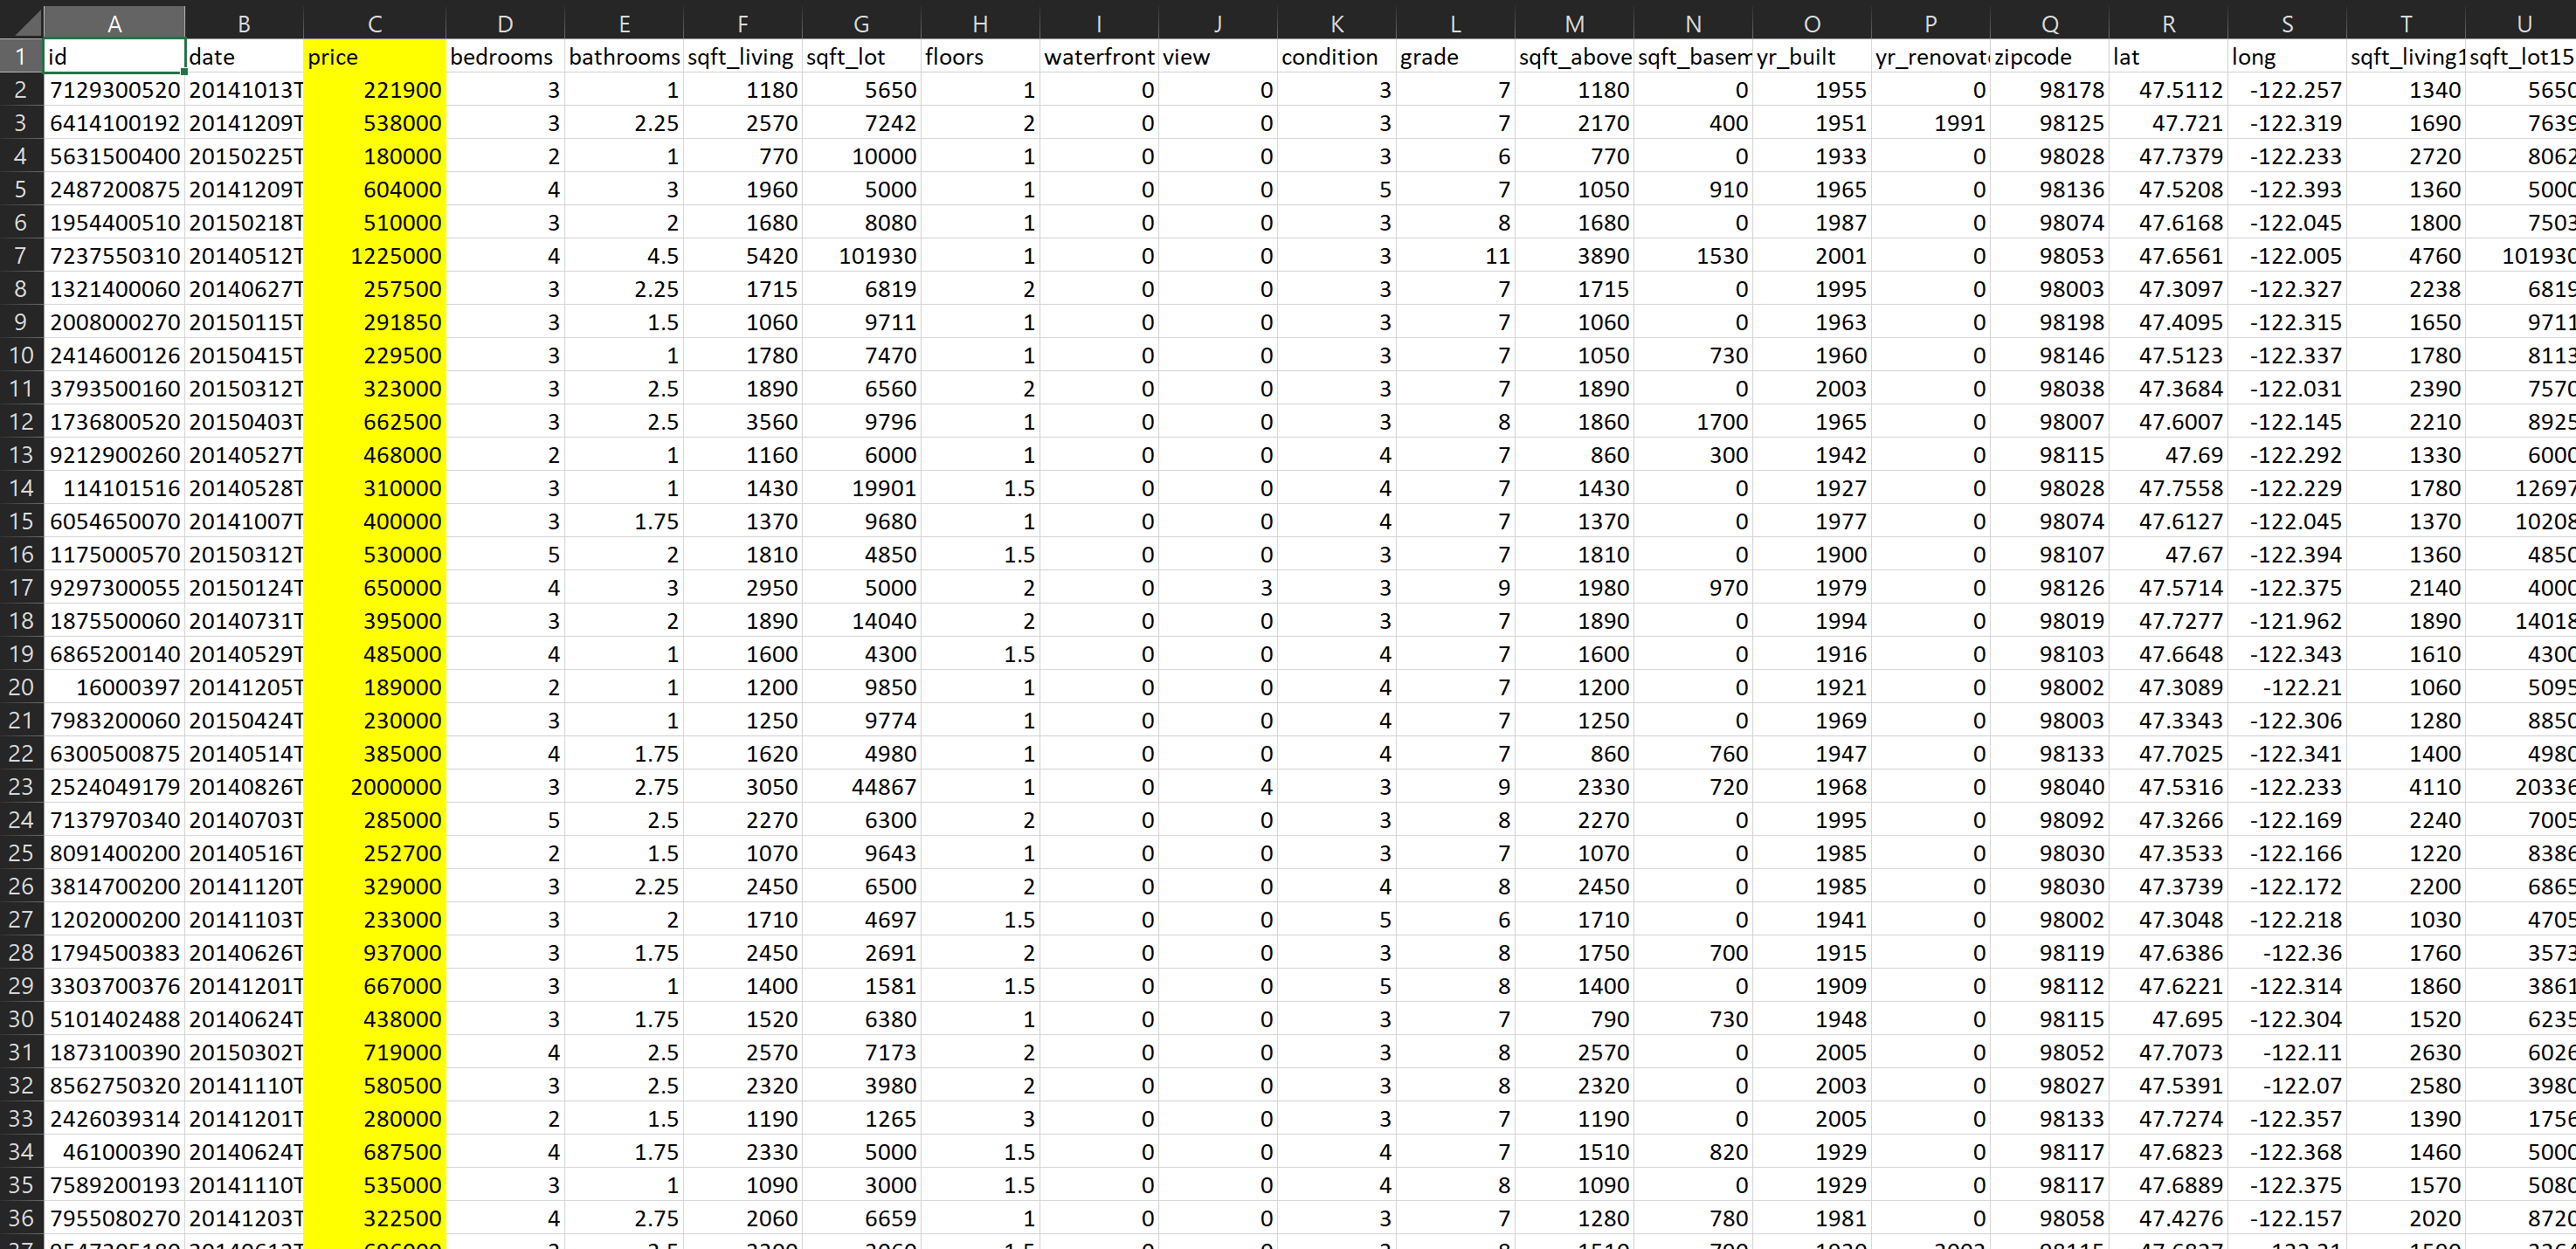
Linear Regression is known as one of the most basic mathematical models that is commonly used in price prediction models. For simplicity’s sake we’ll be using a public dataset from Kaggle representing King County (Washington state) house sales. This data consists of 21,613 observations across 20 different independent variables and 1 depedent variable (Price), also known as our target variable.
The goal is to use Vertex AI to train a model to use the 20 independent variables to determine the 1 dependent variable, as we are hoping to predict the sale price of a house.
The high-level steps we are going to follow are:
- Create a new dataset.
- Select Regression/Classification as the objective (model) type.
- Upload our dataset - a CSV file in this case.
- Select a GCP Cloud Storage to save it to
- Review the dataset information and summary statistics.
- Specifically identify missing data.
- Split train/test/validation data
- Train an AutoML regression model.
- Deploy the model to a container endpoint.
- Test predictions against the container endpoint
-
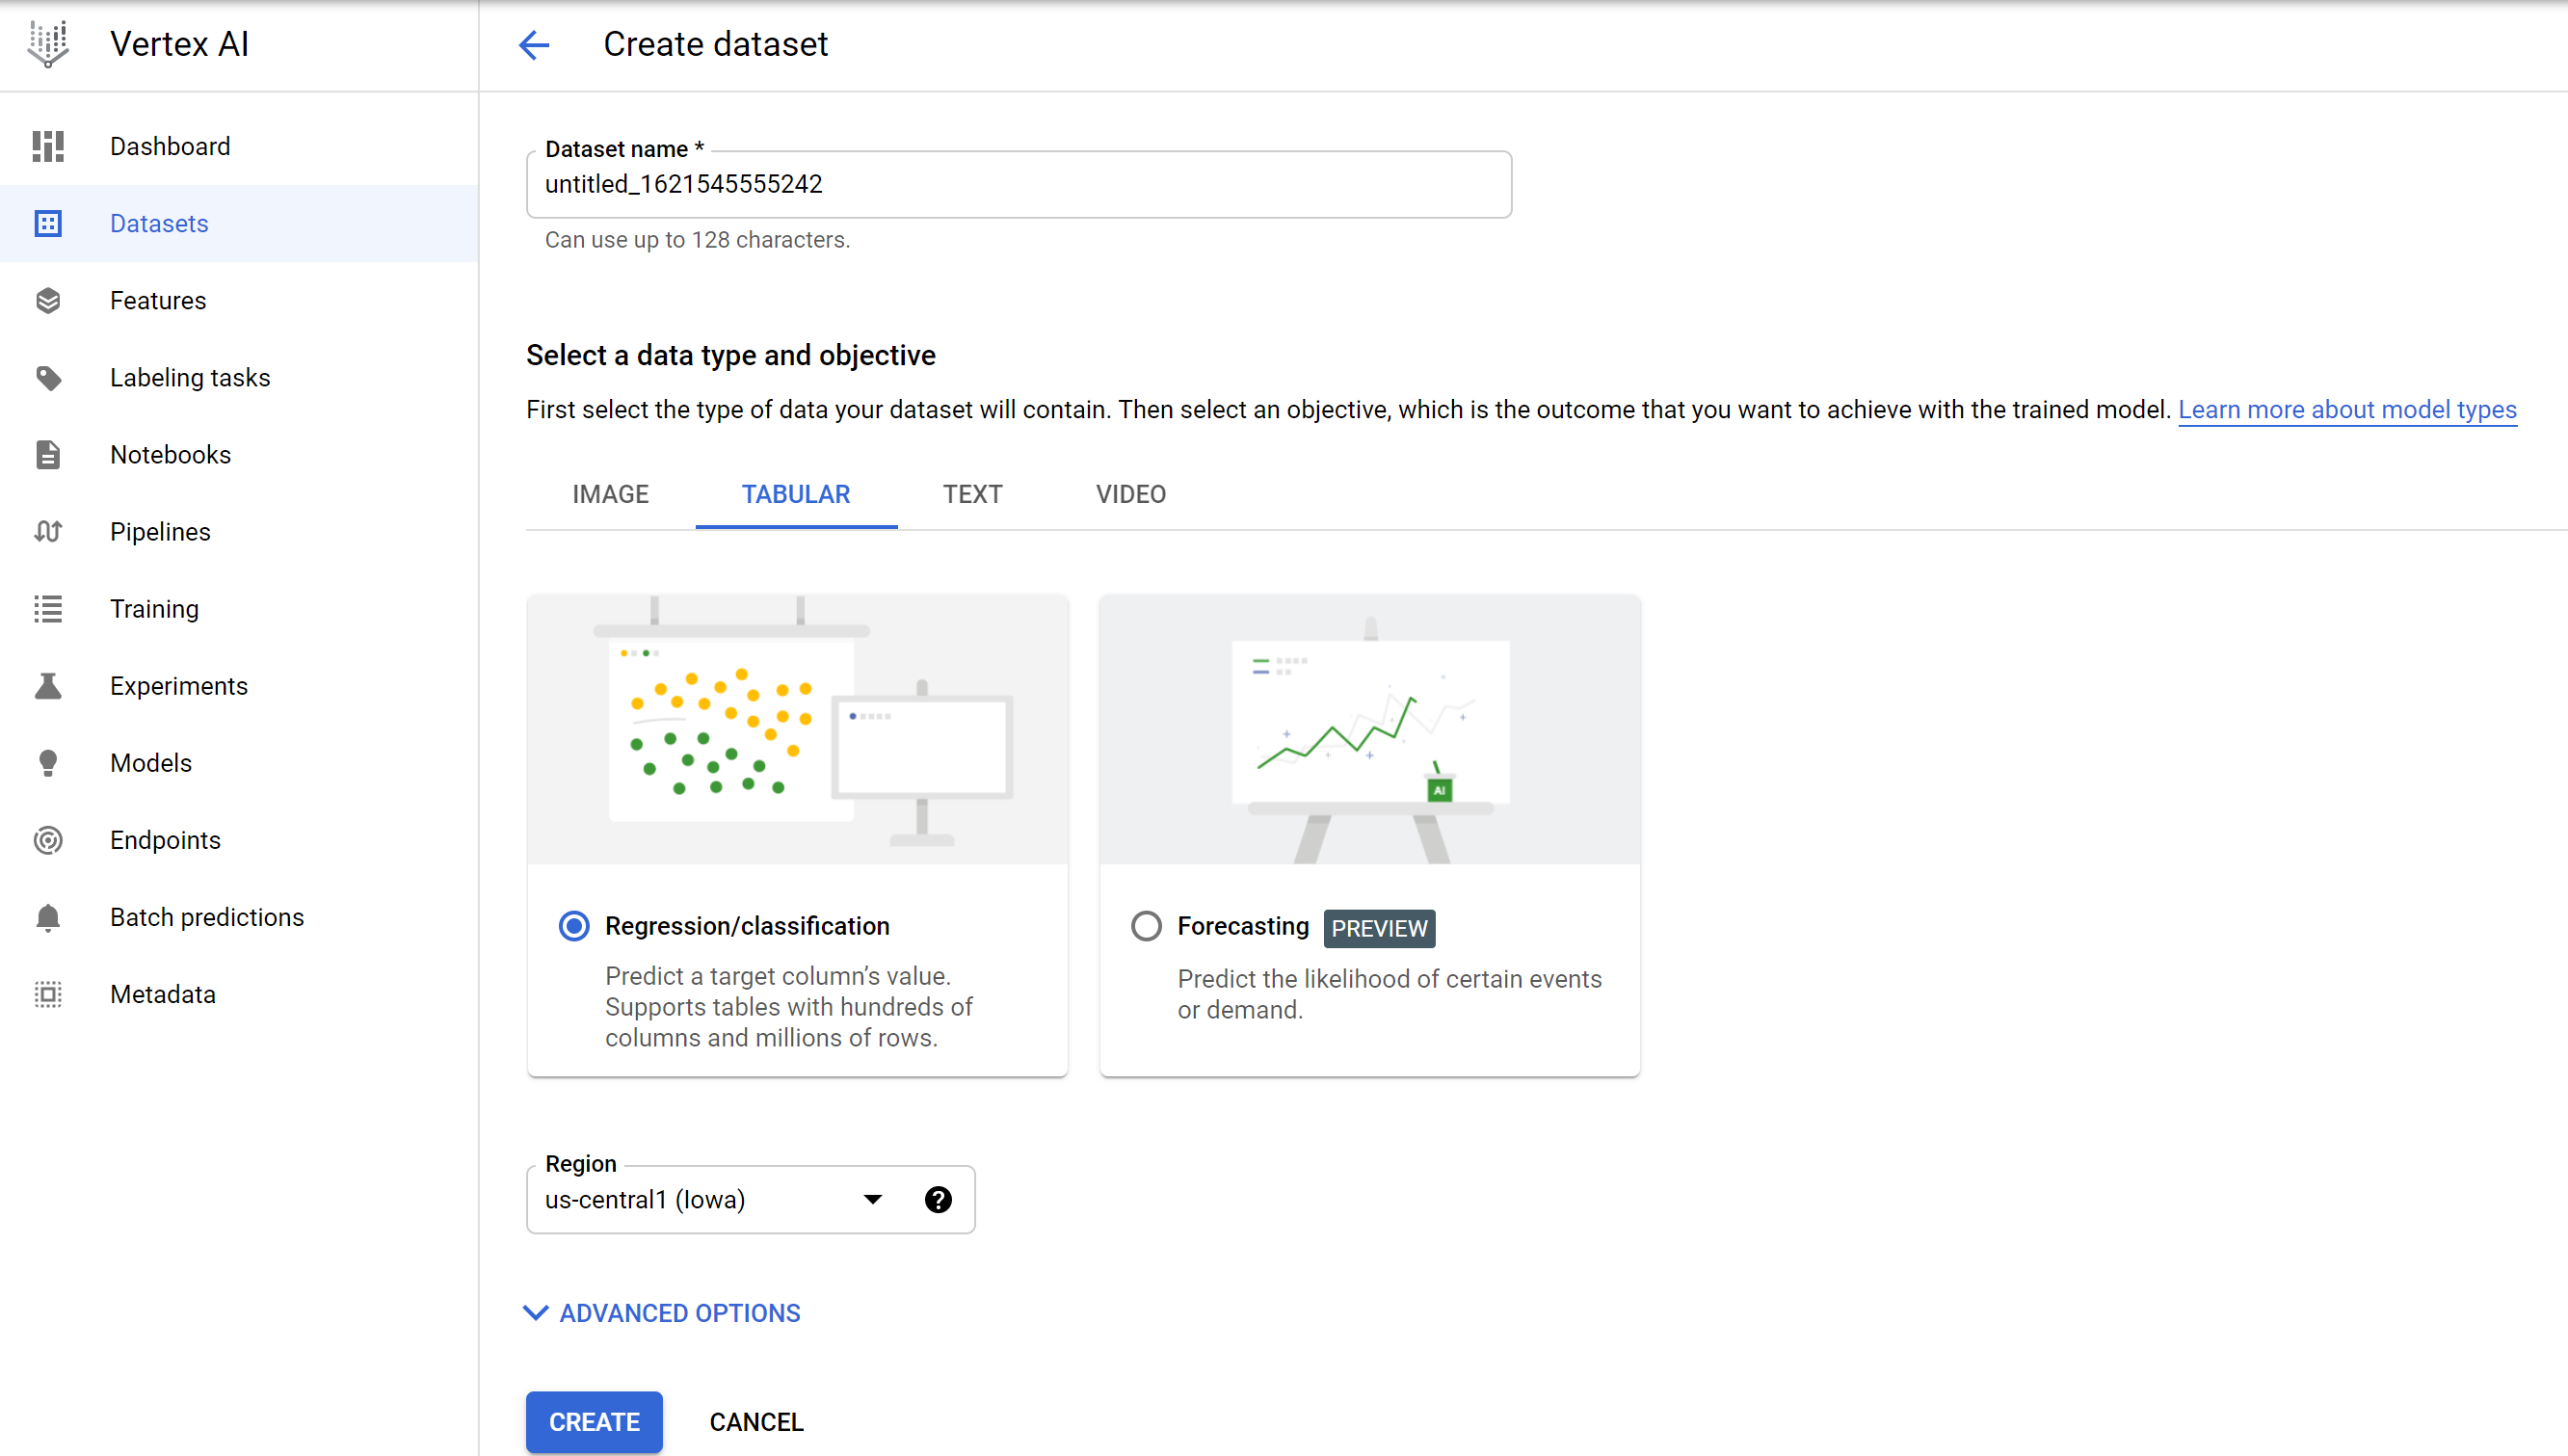
To start off, select Datasets and then TABULAR, as the data we are working with is tabular. :)
-
Select Regression/Classification and then hit Create.
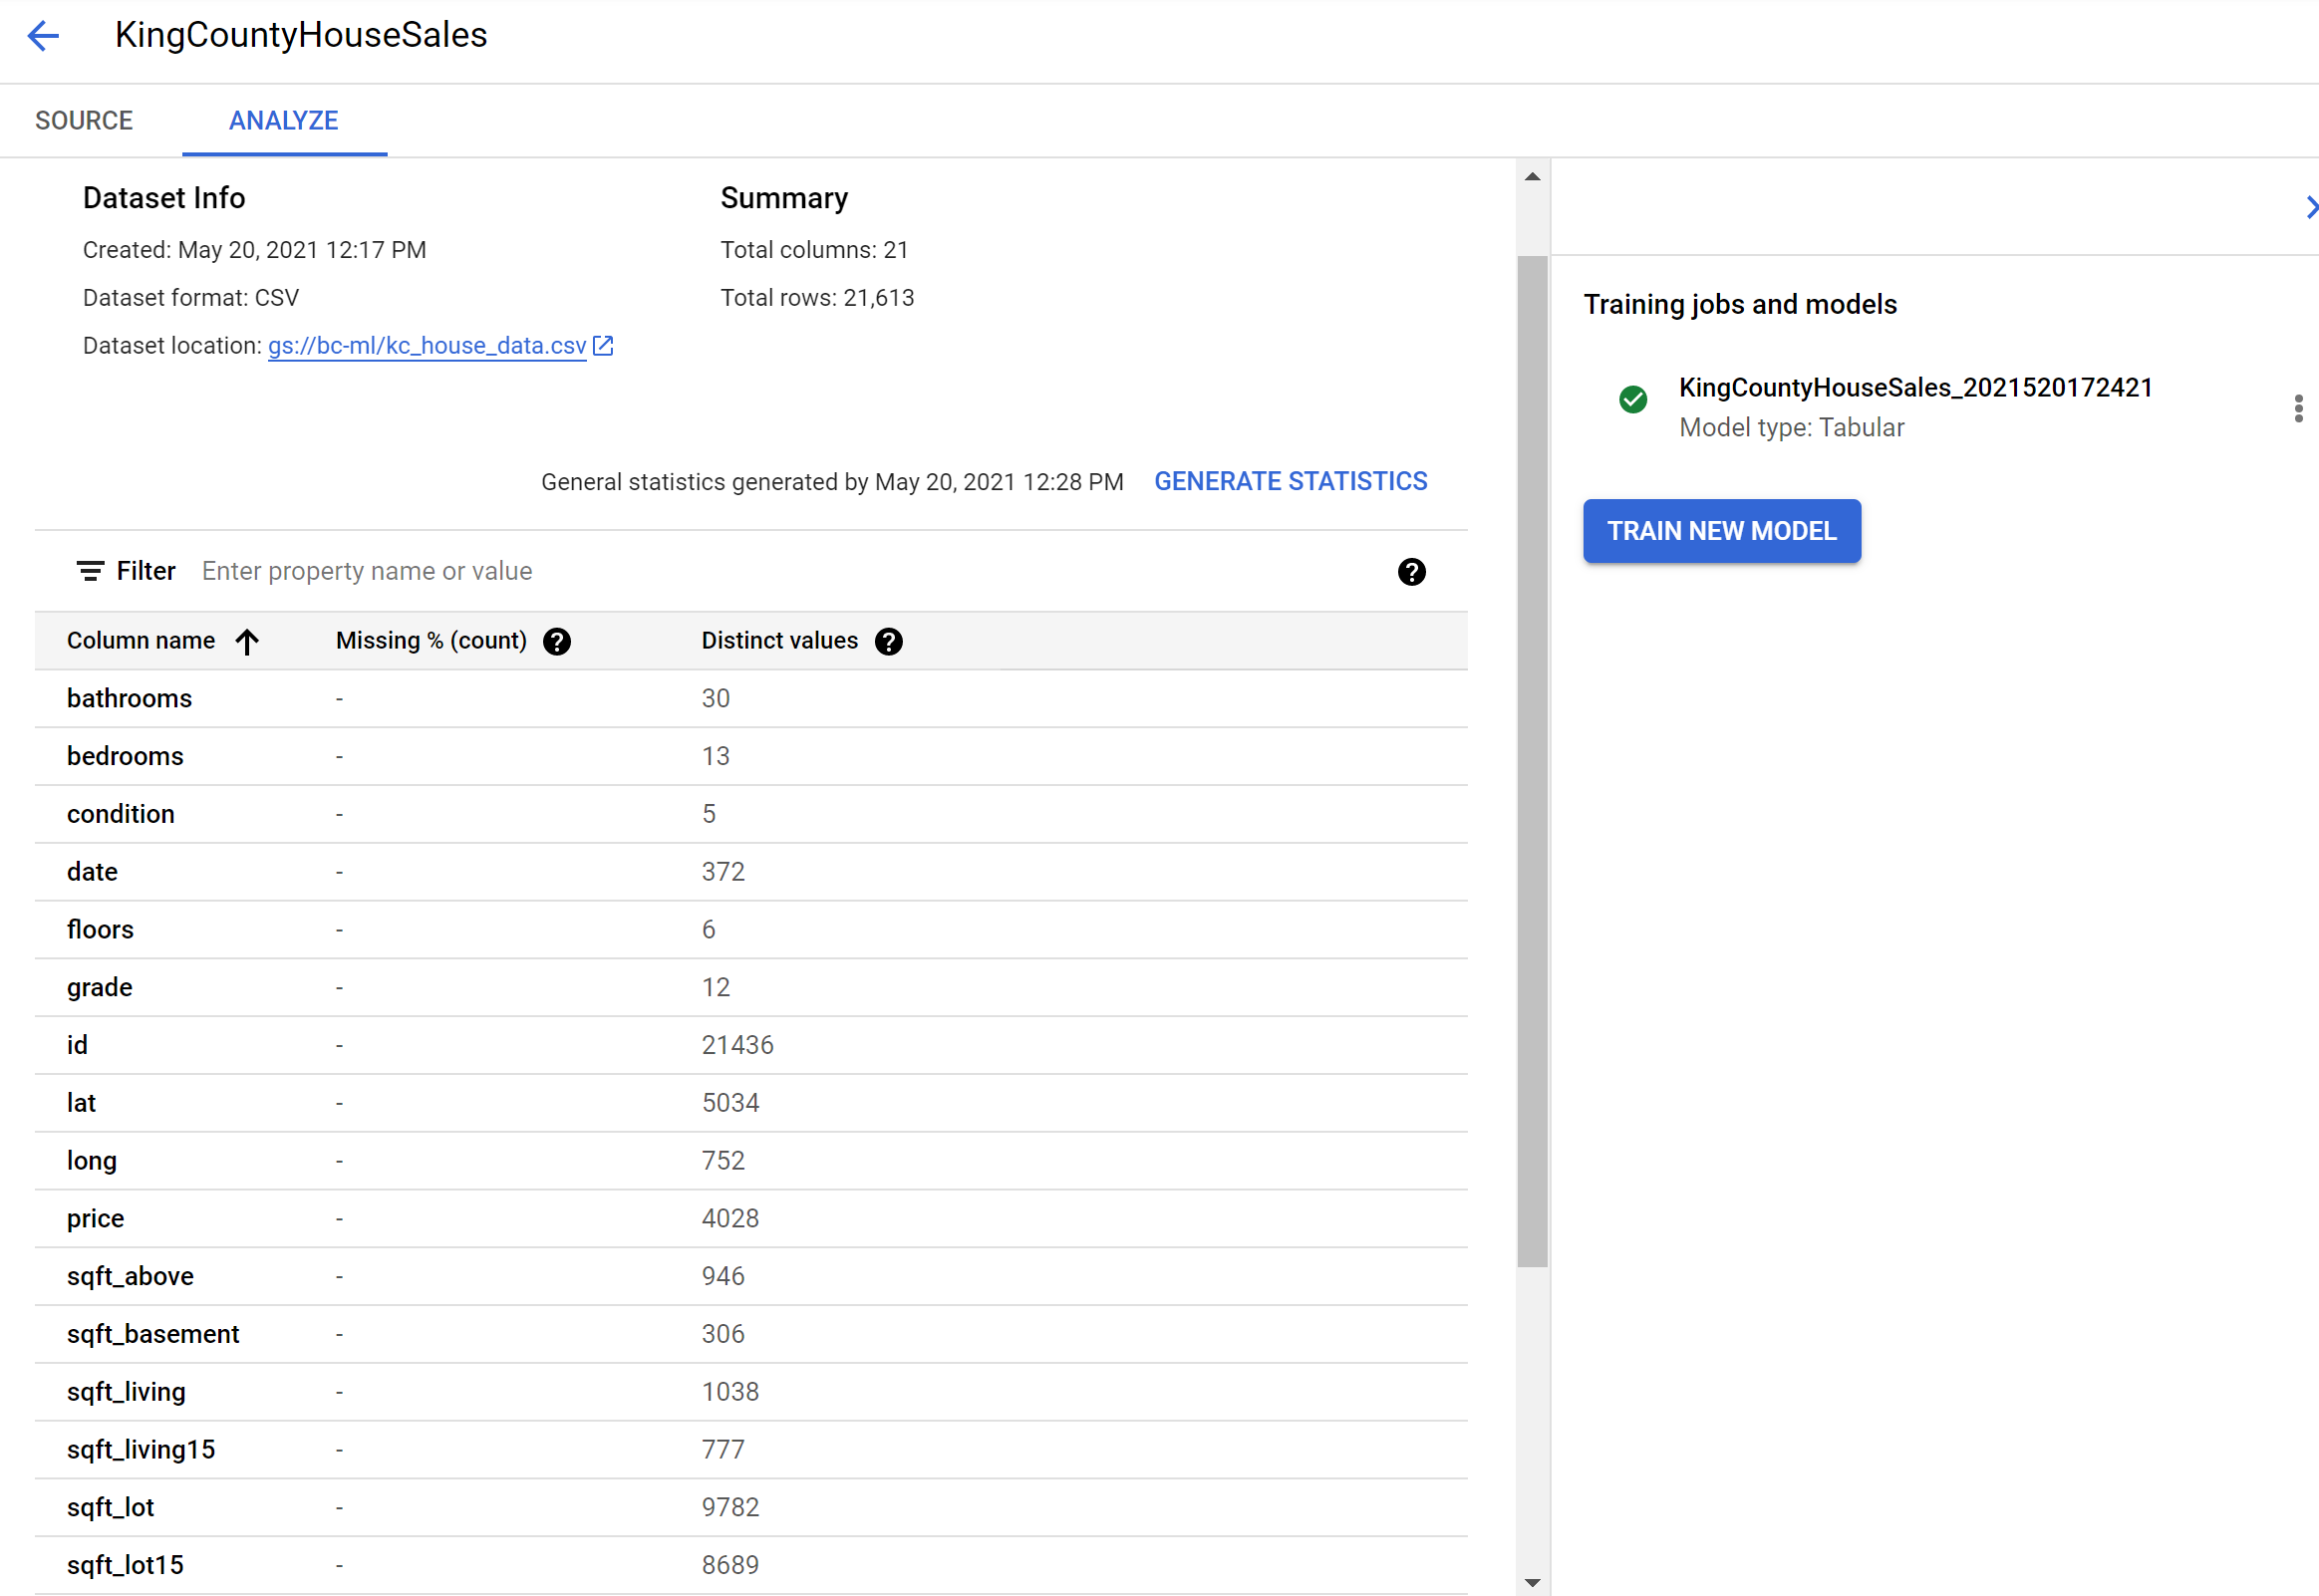
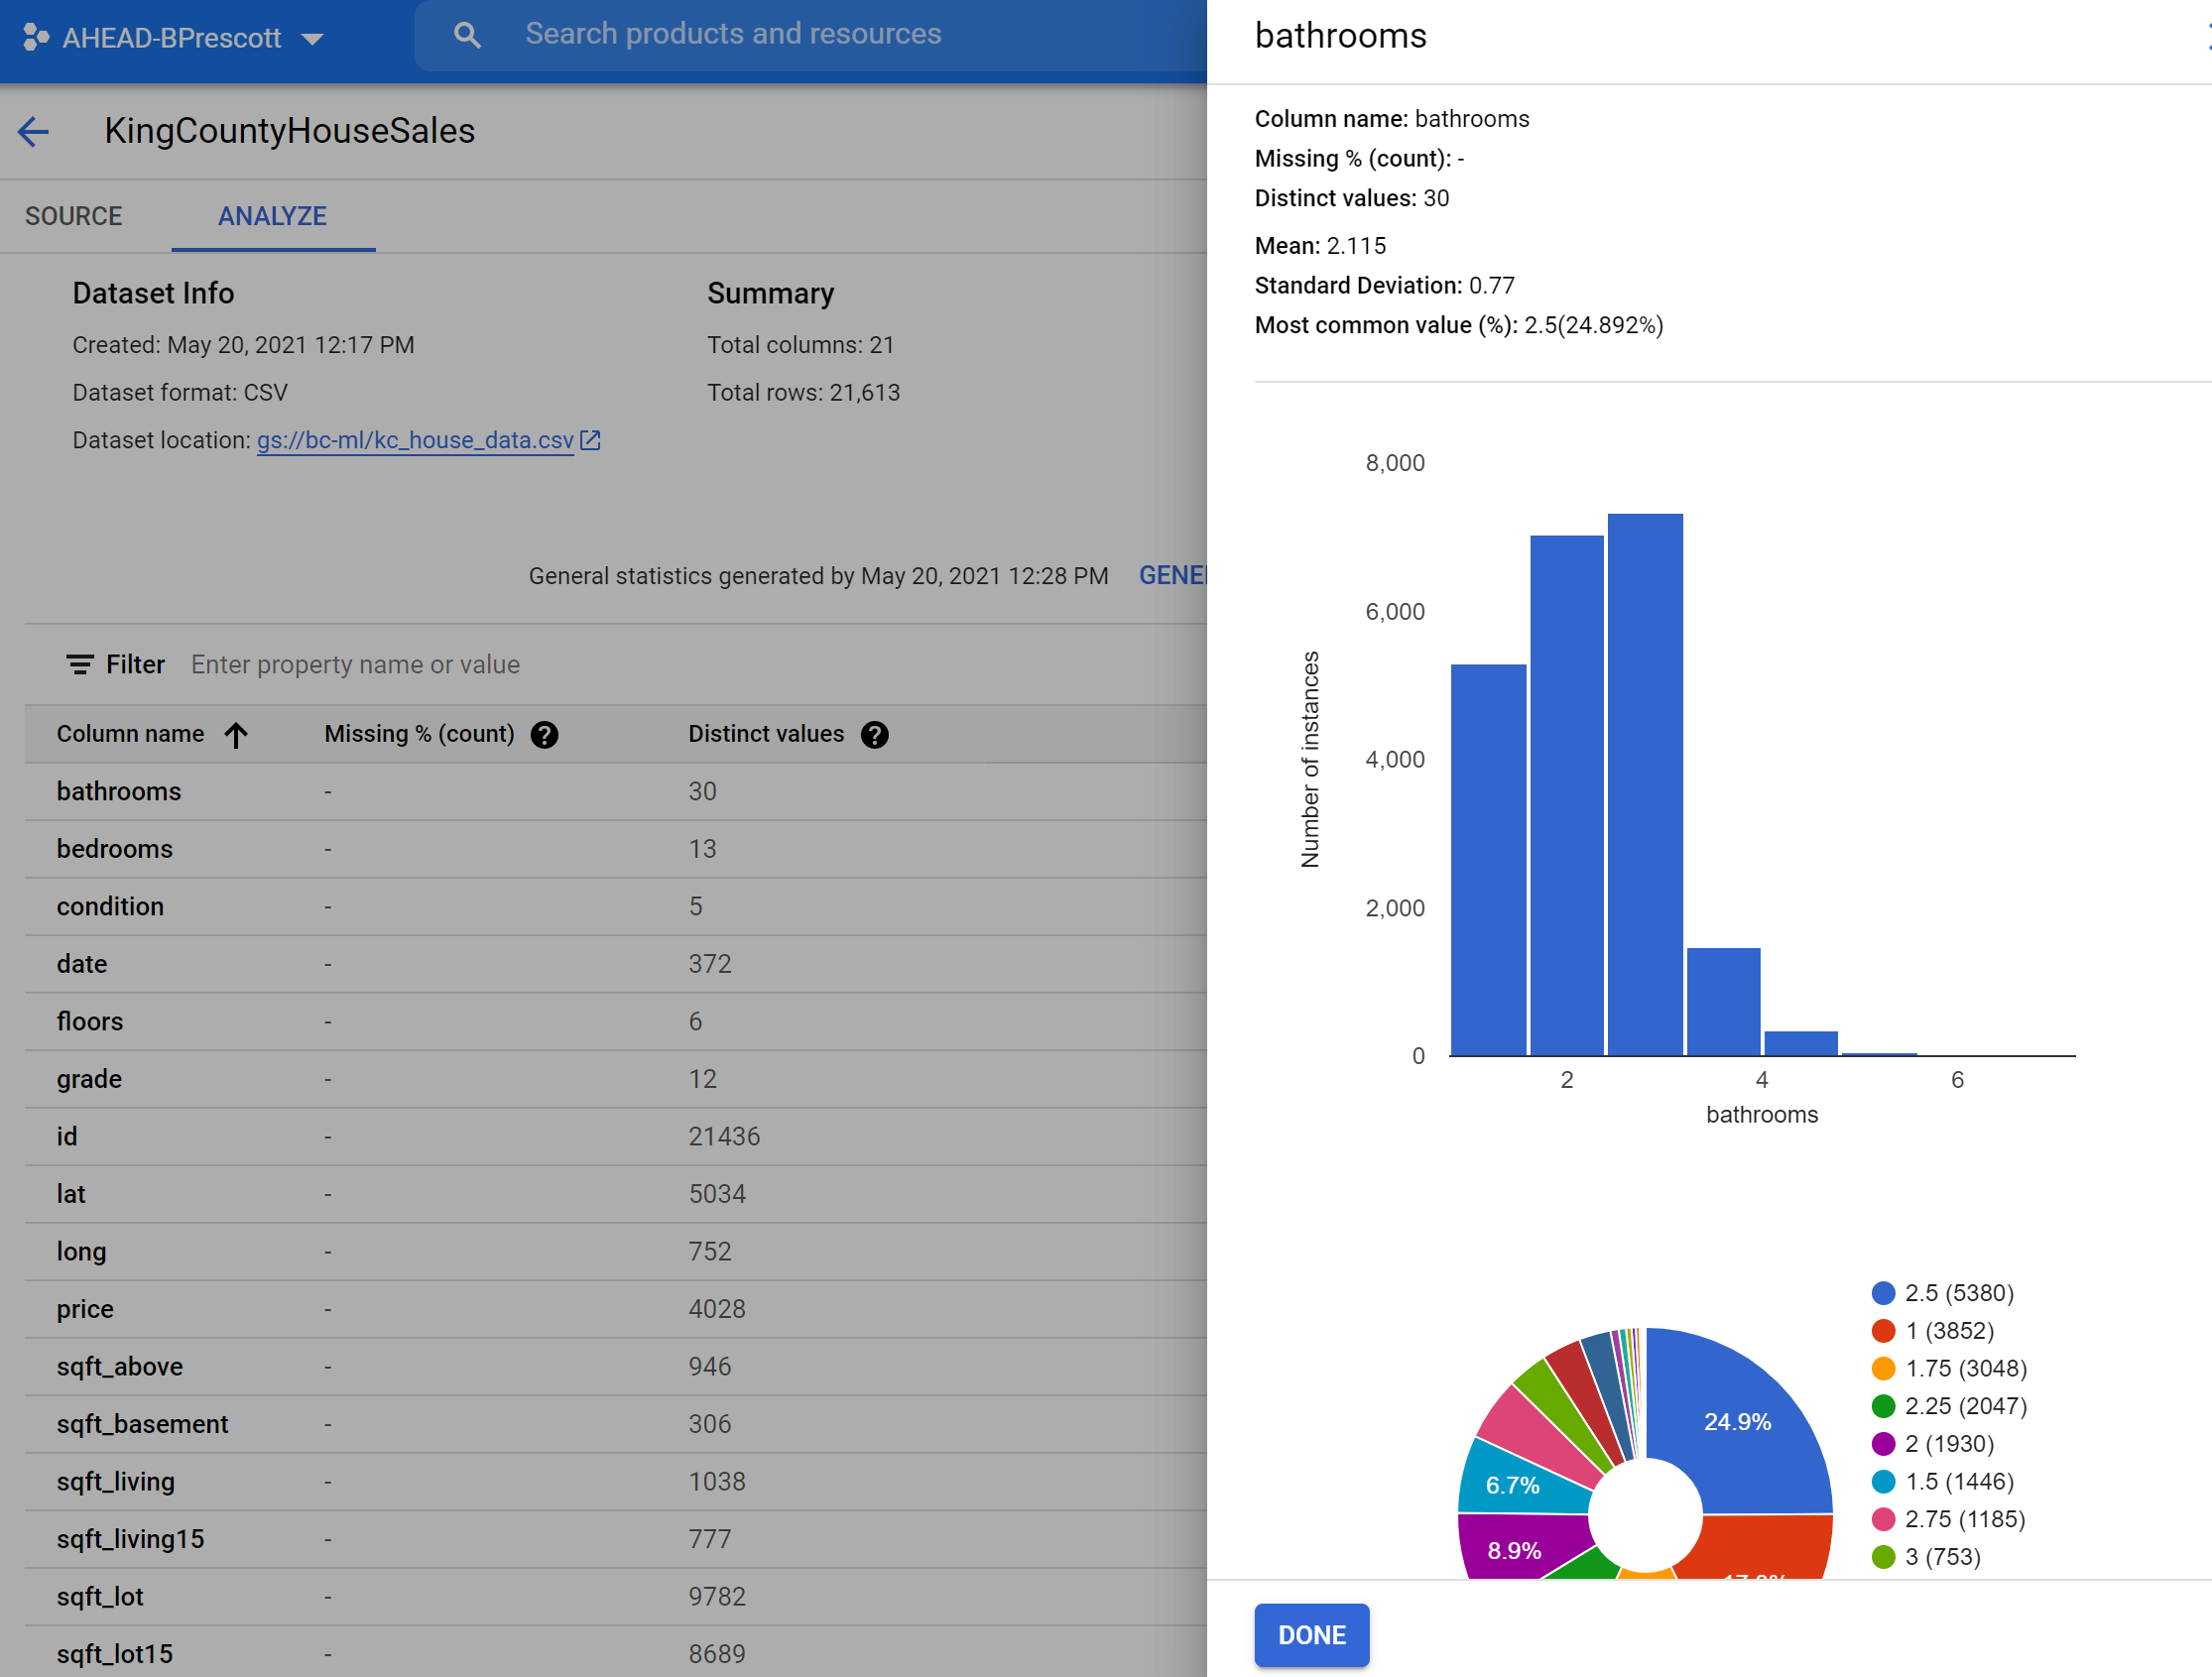
Once our dataset is uploaded, we can see information on the dataset, as well as being able to generate statistics. Generating summary stats will provide information like the below. You can also click on each feature/column name and see additional detail.
Training the Model
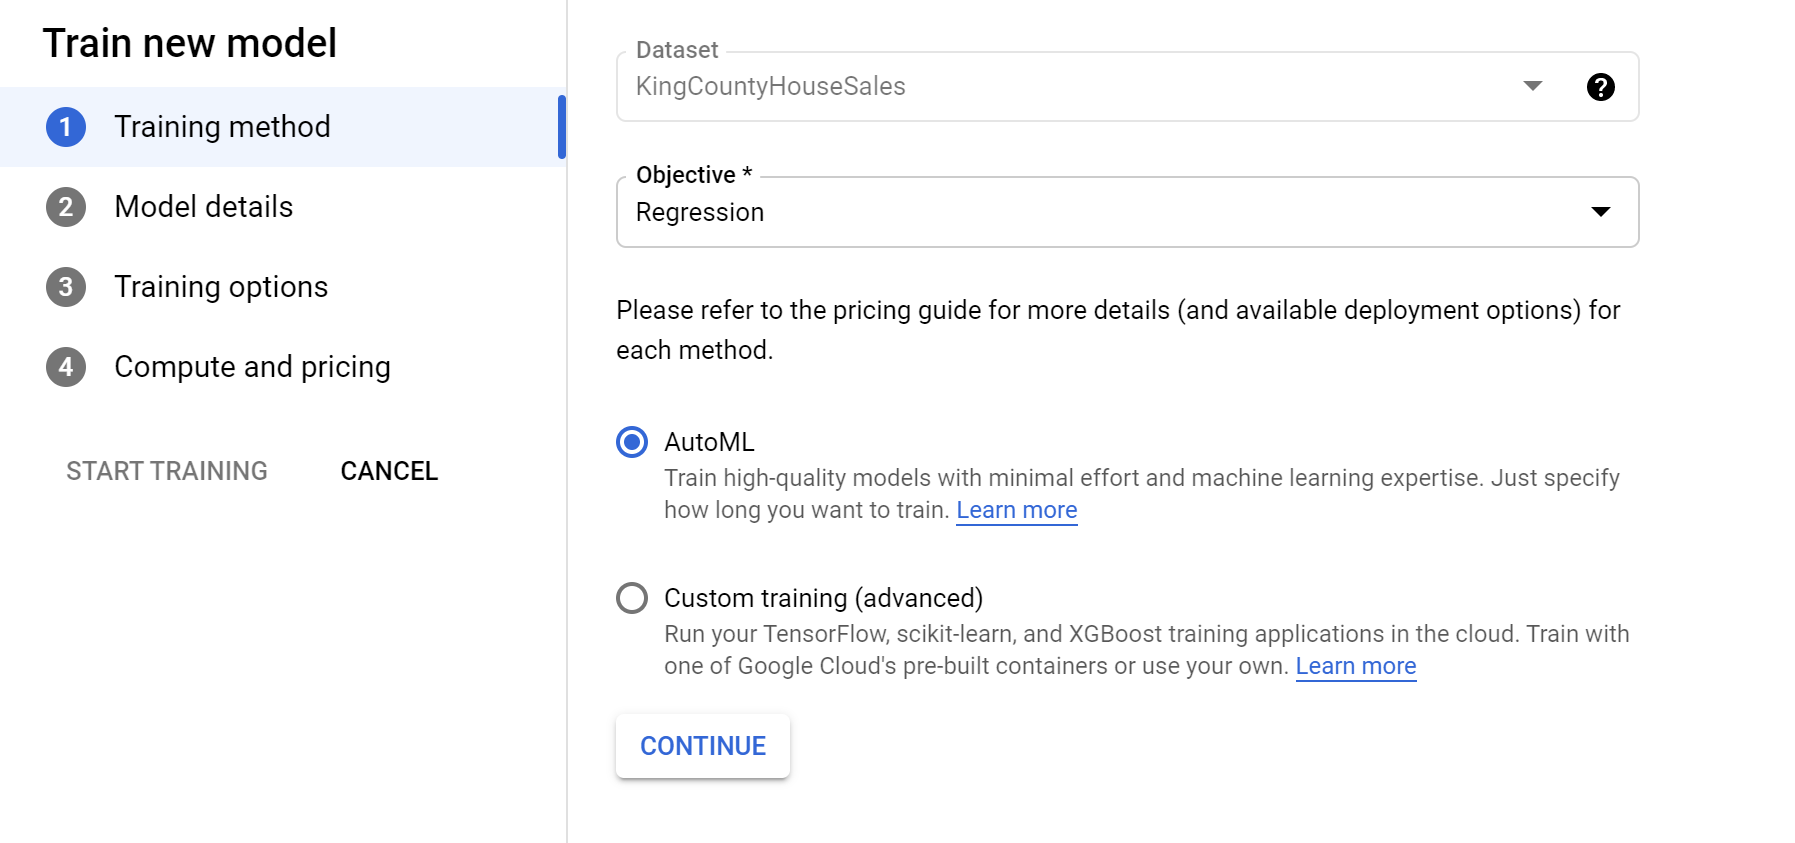
On the same Datasets page, the Analyze tab has the option to “Train New Model”. Select this and you will see an option to select the Objective.
Since we are looking to predict a house’s sale price we need to select Regression as the Objective. We will also stick with AutoML, which is going to identify the data types and adjust the model hyperparameters to get the best results based on how long we allow it to train.
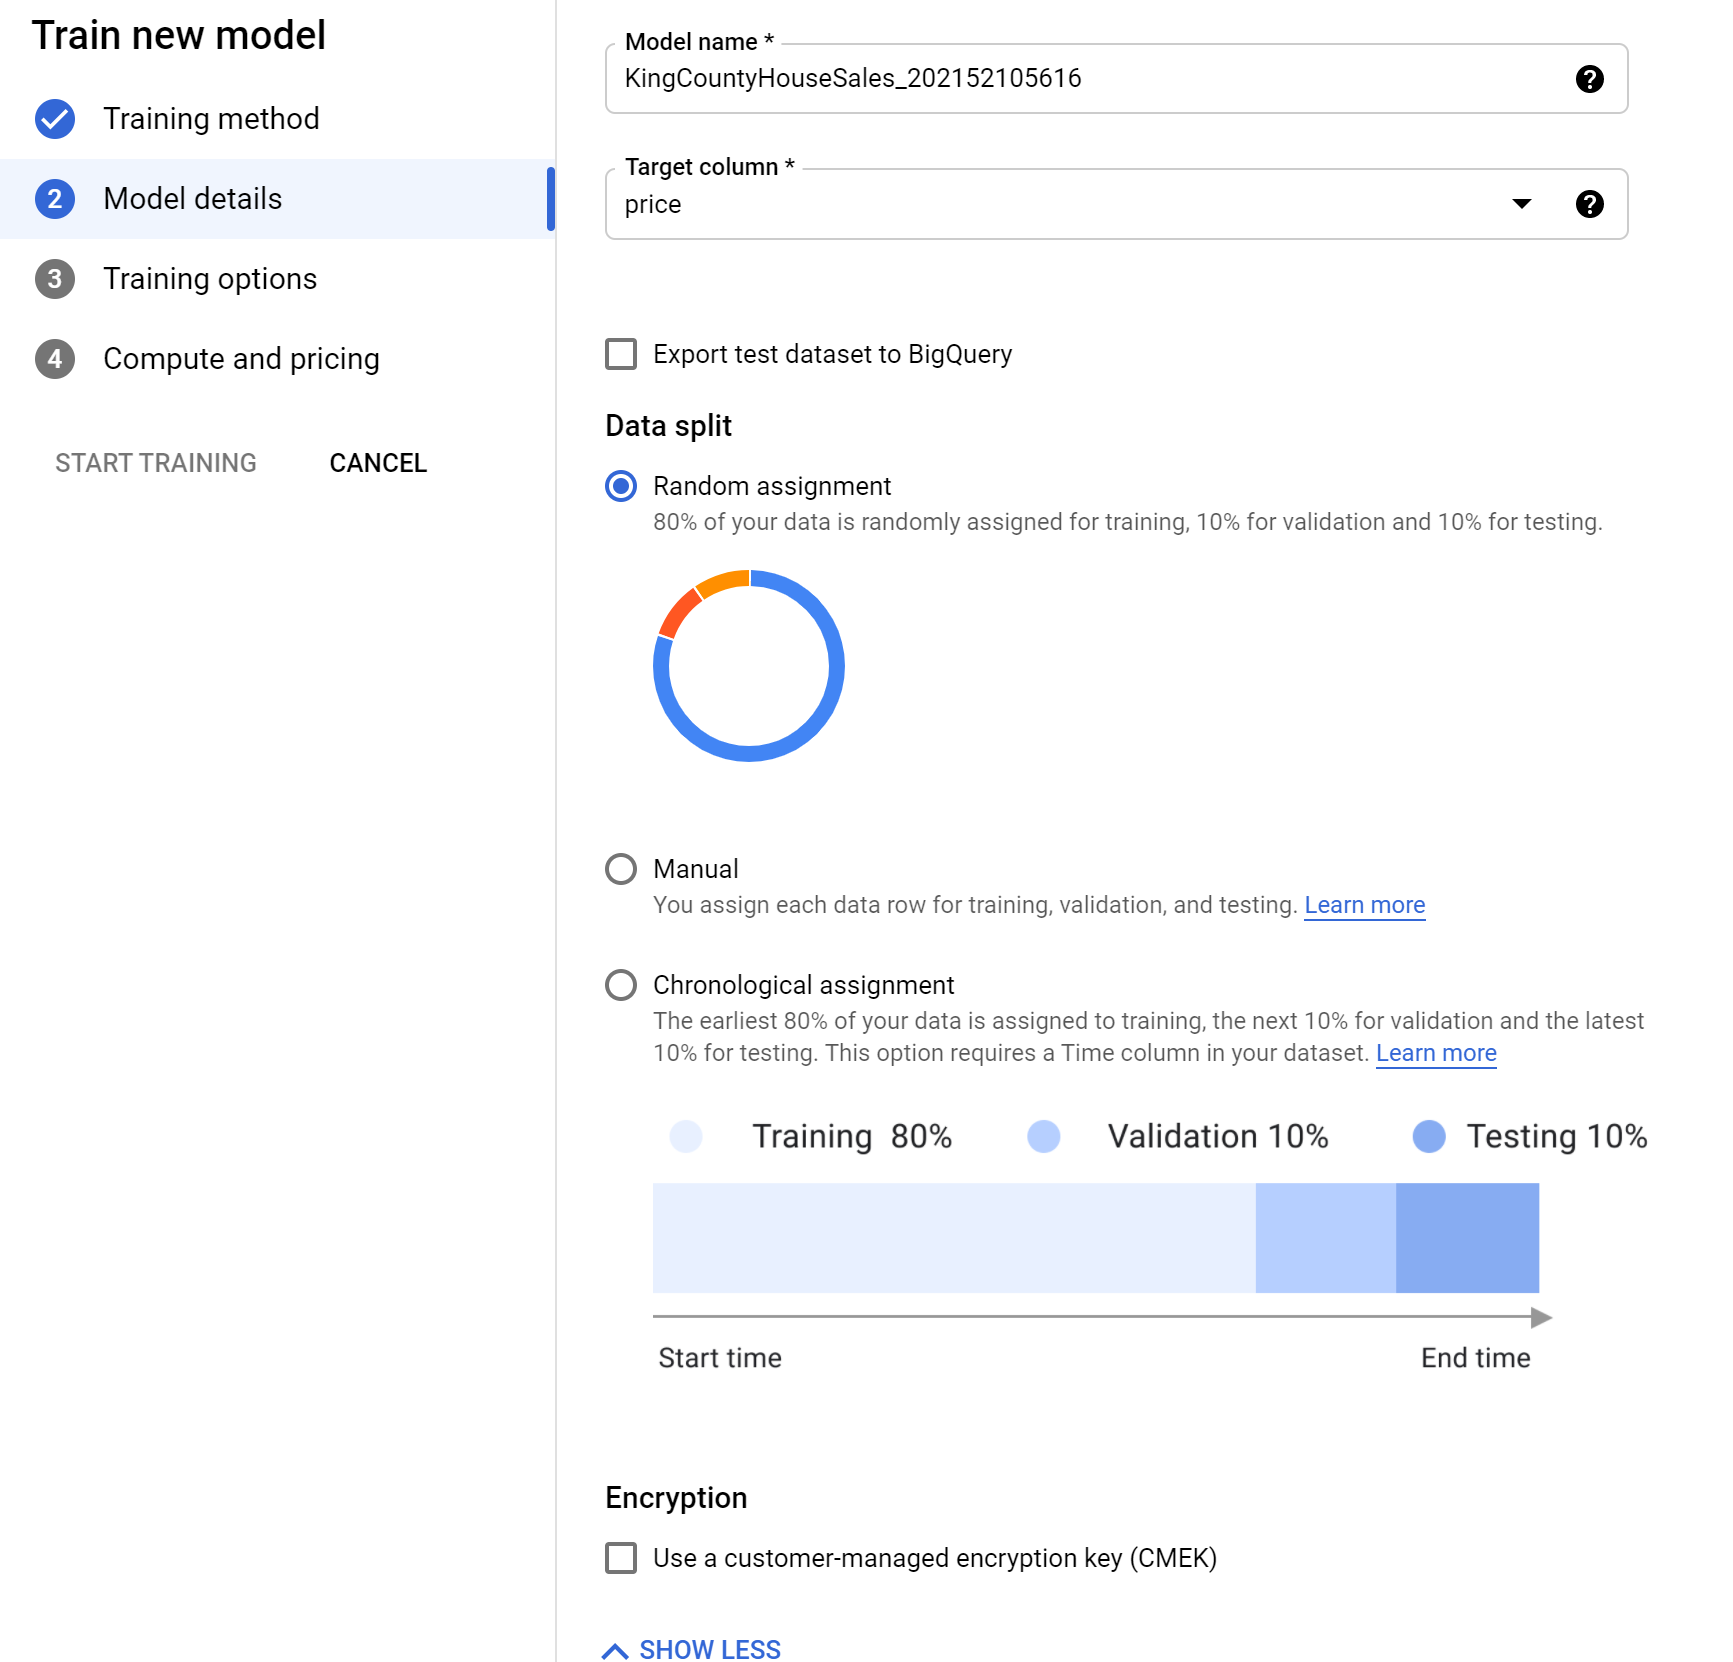
On the next page you have the option to define the target (dependent) variable. Since we’re trying to predict the price, we’ll select price as our target column. Selecting Advanced Options also provides the option to define how your data will be split for train/test/validation sets.
I do wish this provide more flexibility over the split percentages, but we will stick with the Random Assignment split of 80/10/10. This states that 80% of our data will be used to train, 10% will be used to validate performance and tune the model’s hyperparameters, and 10% will be saved to act as ‘unseen data’ for generalization testing.
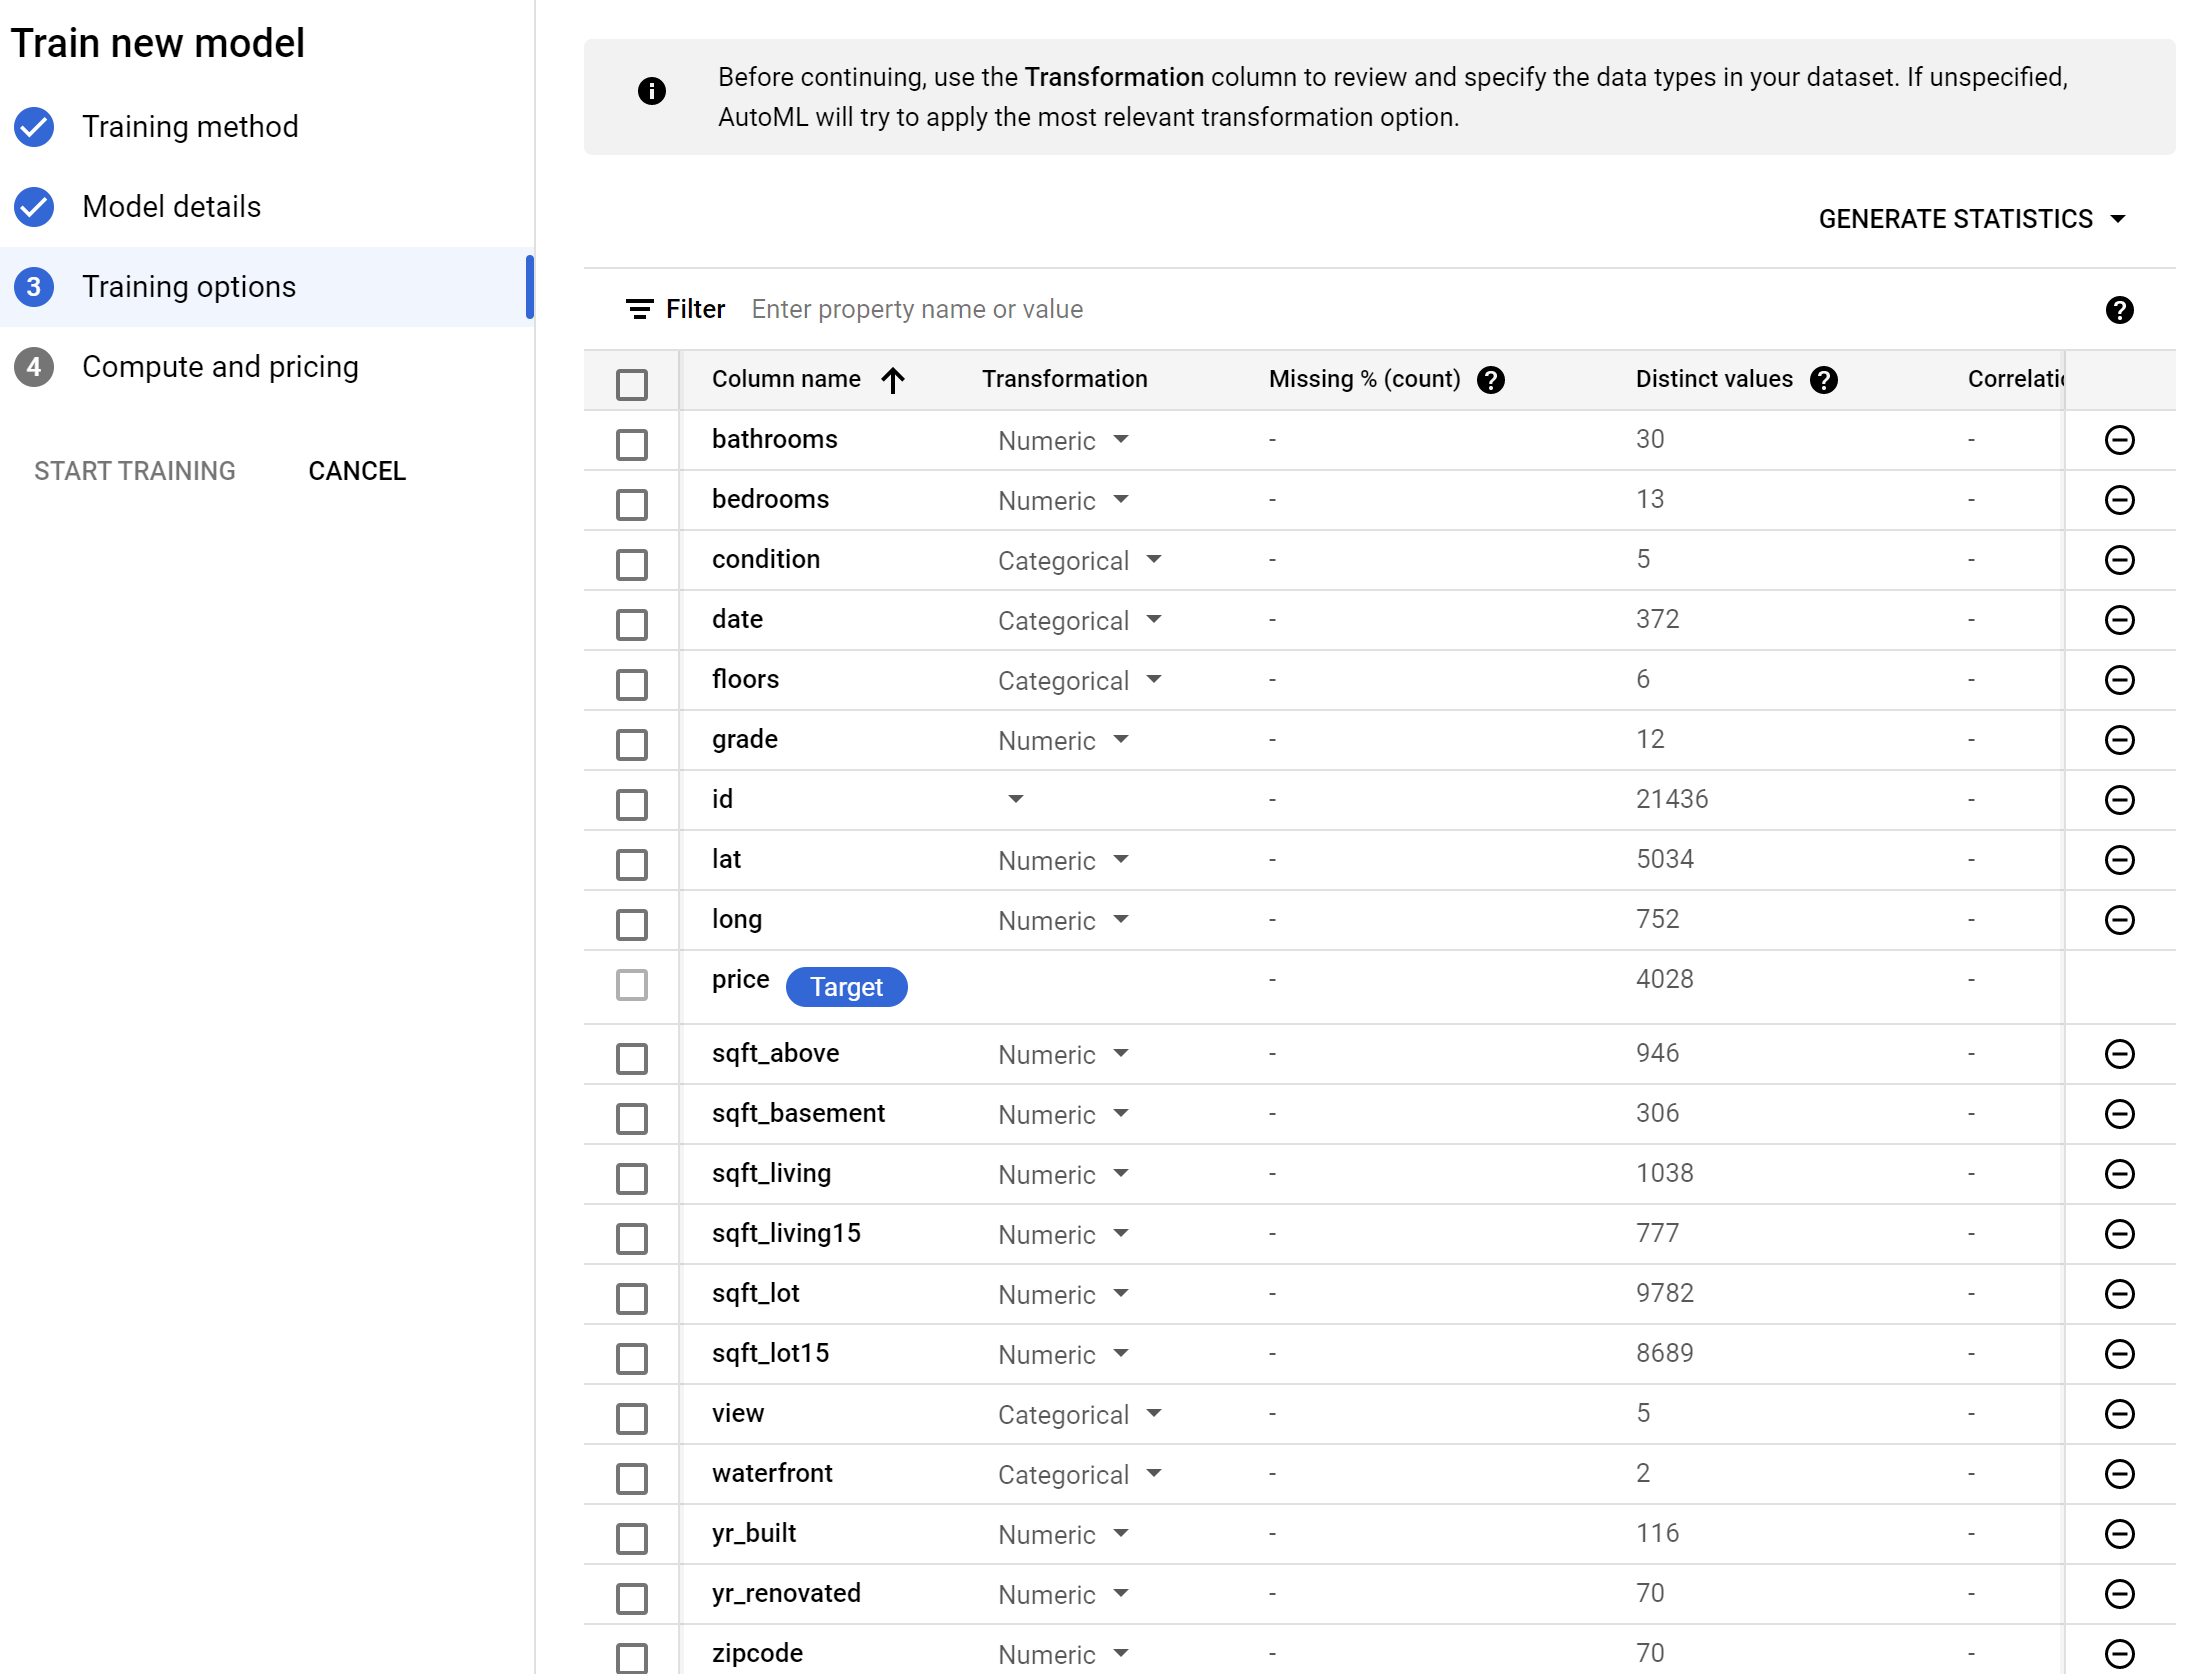
The Training Options page will show all your columns/features, display the target column (dependent variable), and what data type each column is. If it does not display a type, then AutoML will use its best judgement to determine the data type. Feel free to adjust any of the transformations to fit your use case or leave them be.
Selecting Advanced Options also provides us with the option to select our model’s performance metric. The metrics provided are specific to the algorithm type (linear regression in this case). For more information on metric specifics, check out this link.
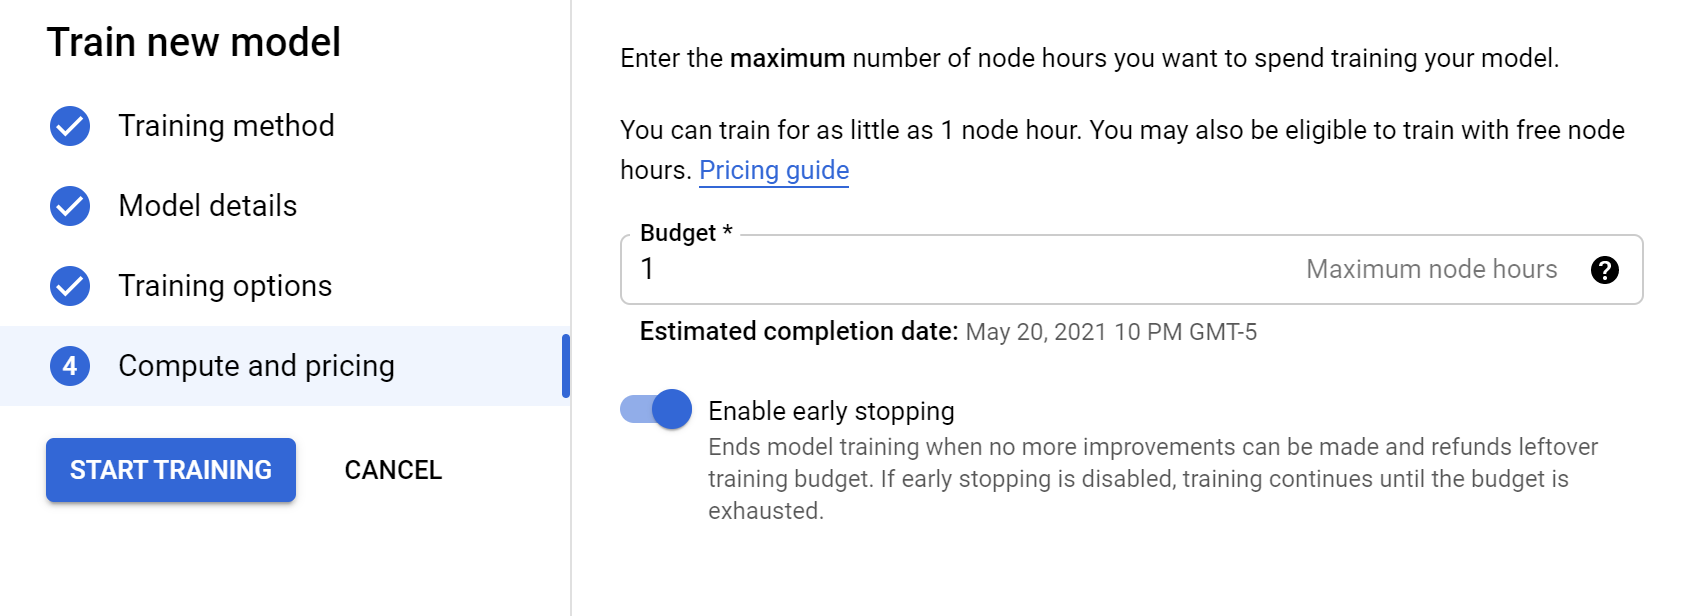
The final page provides us with how many node hours you want to train for. The longer you train the more likely your model improve, or you could potentially overfit. Use the link next to the Node Hours box to check out pricing and suggestions.
Also, be sure to check “Enable early stopping”, as this will identify when a model’s performance doesn’t improve and stop training early. This helps reduce your training costs, as well as keep from potentially overfitting a model.
Once you’re ready, click START TRAINING and wait while the model trains. This may take a while depending on your data and the node hour settings.
Model Deployment & Testing
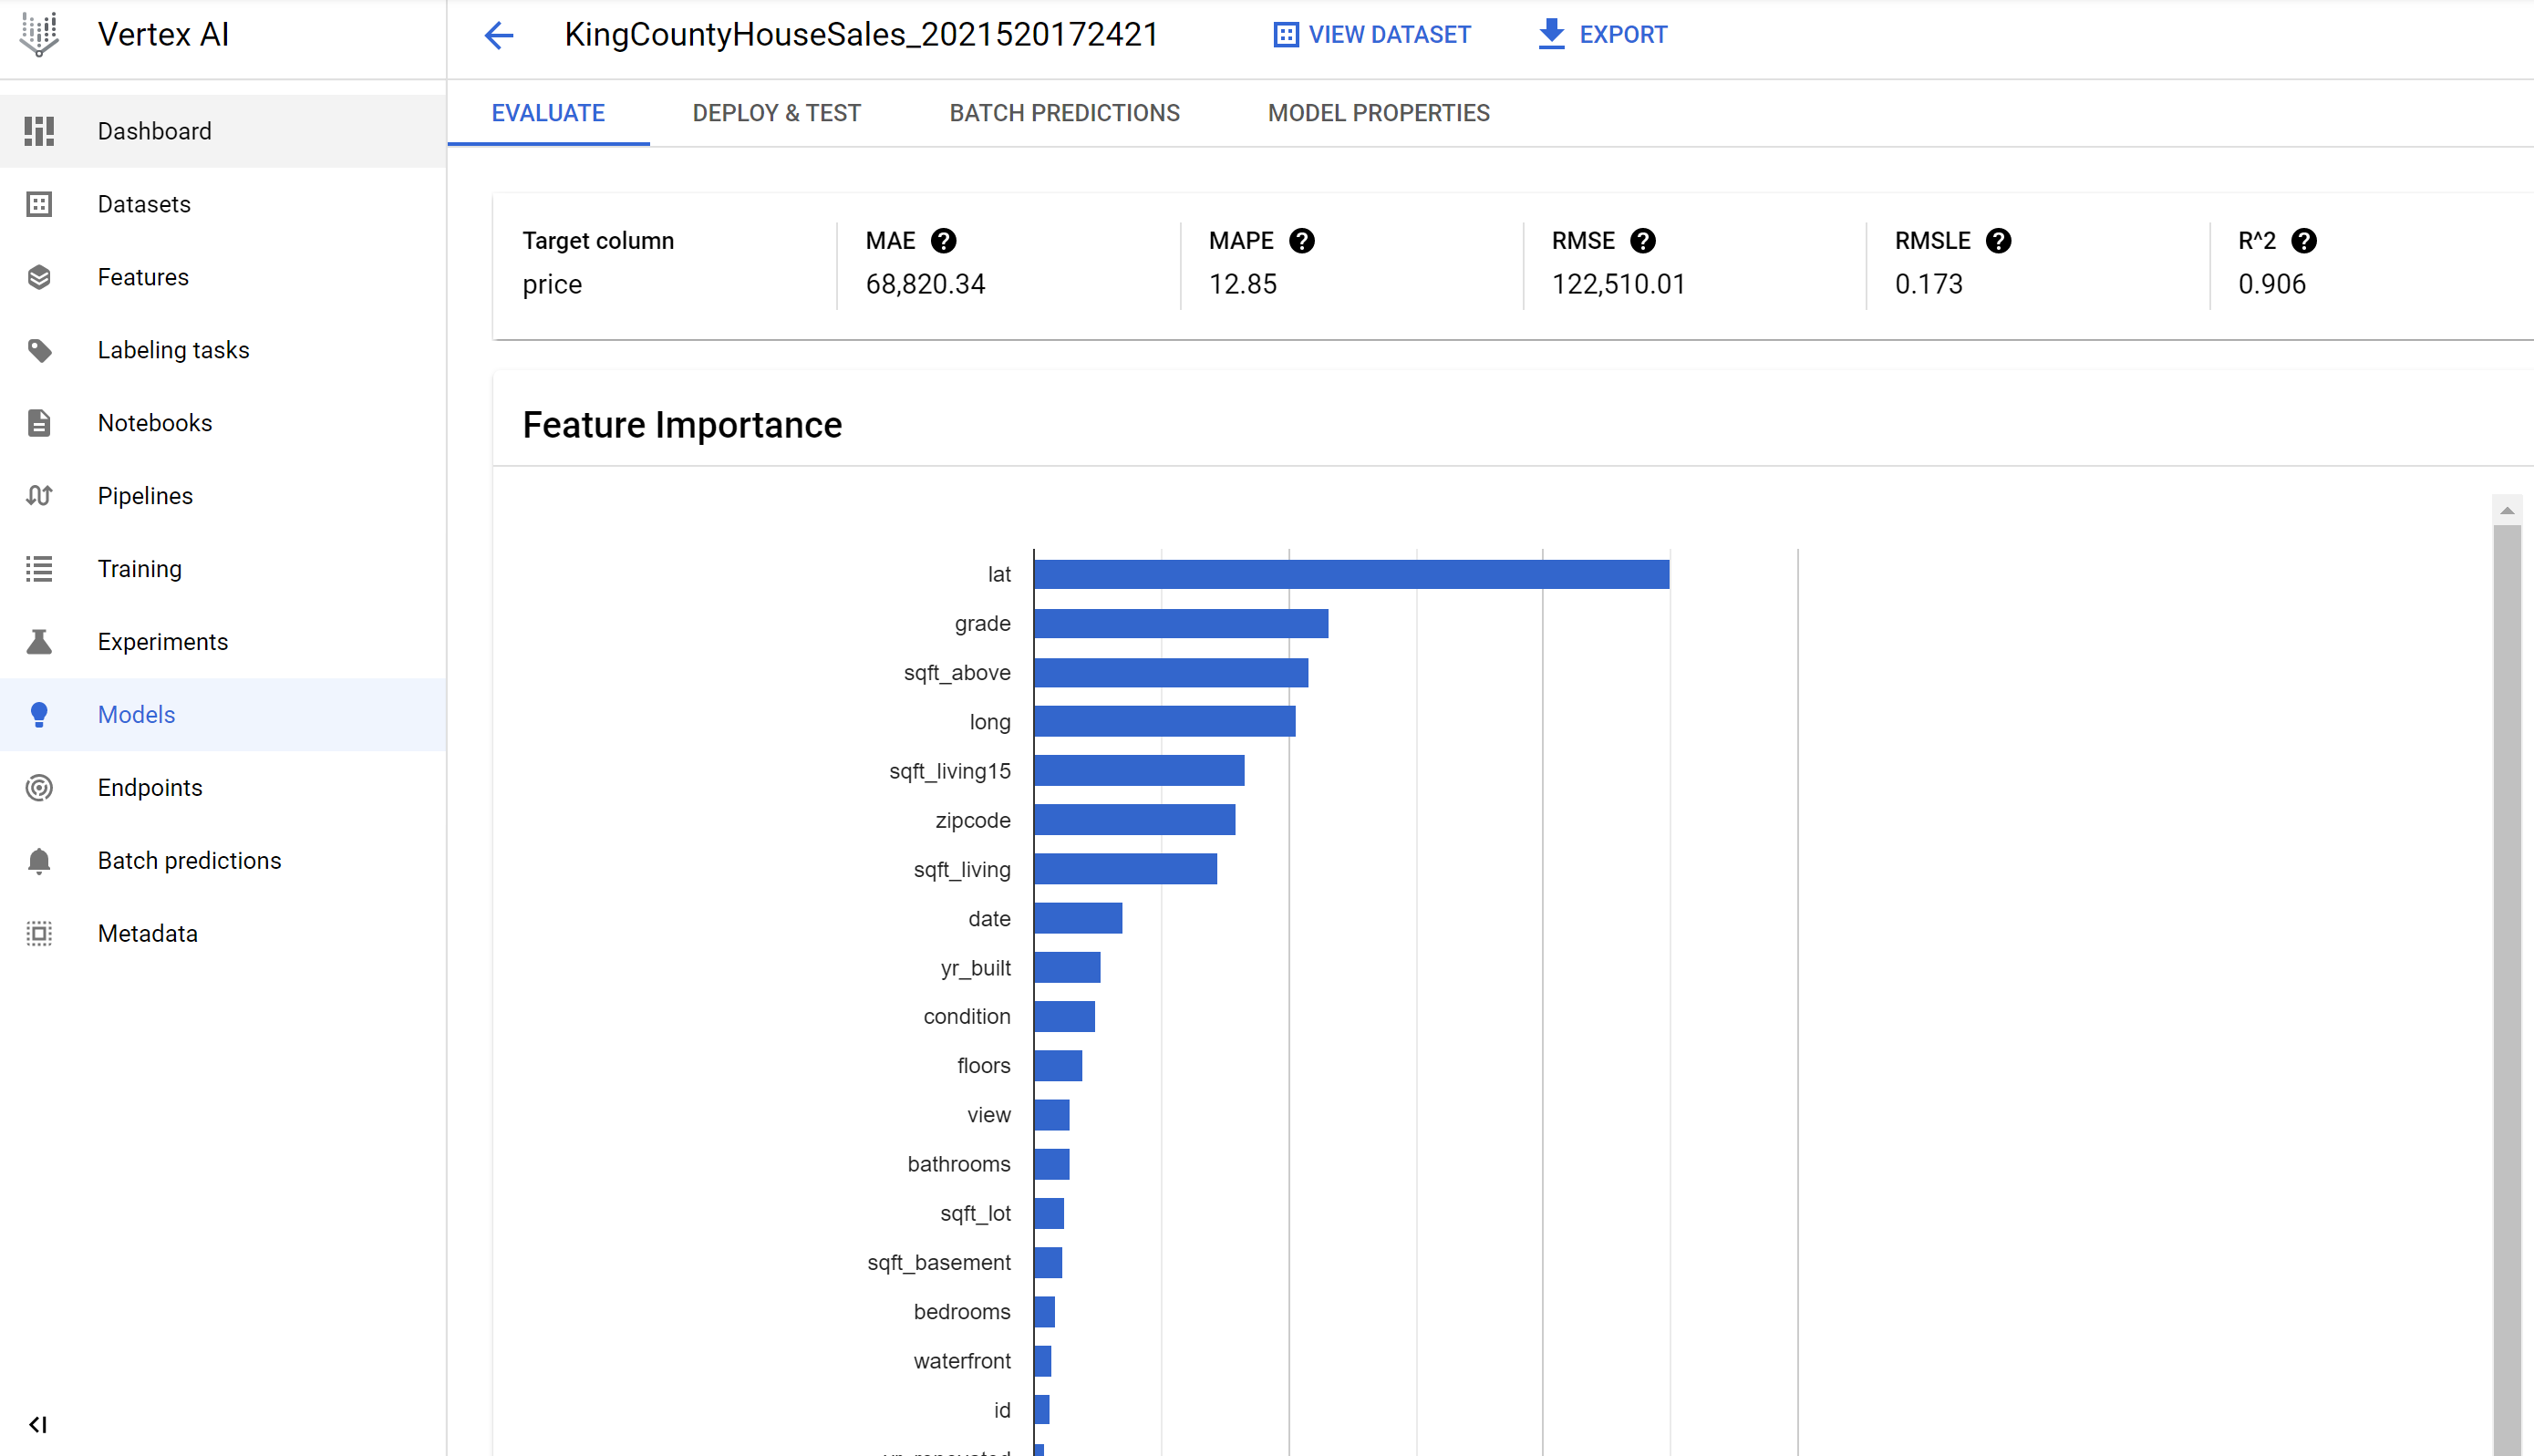
One the training completes you’ll see the model available on the Models pane. Selecting the model will show you what features the model determined as most impactful (heavily correlated) to changes in the dependent variable (price). You can also see some of the metrics mentioned earlier.
Once you’re ready to deploy, move to the Deploy & Test tab and select DEPLOY TO ENDPOINT. This will start deployment to a GCP Docker container, taking care of any backend provisioning requirements and API configuration. Awesome!
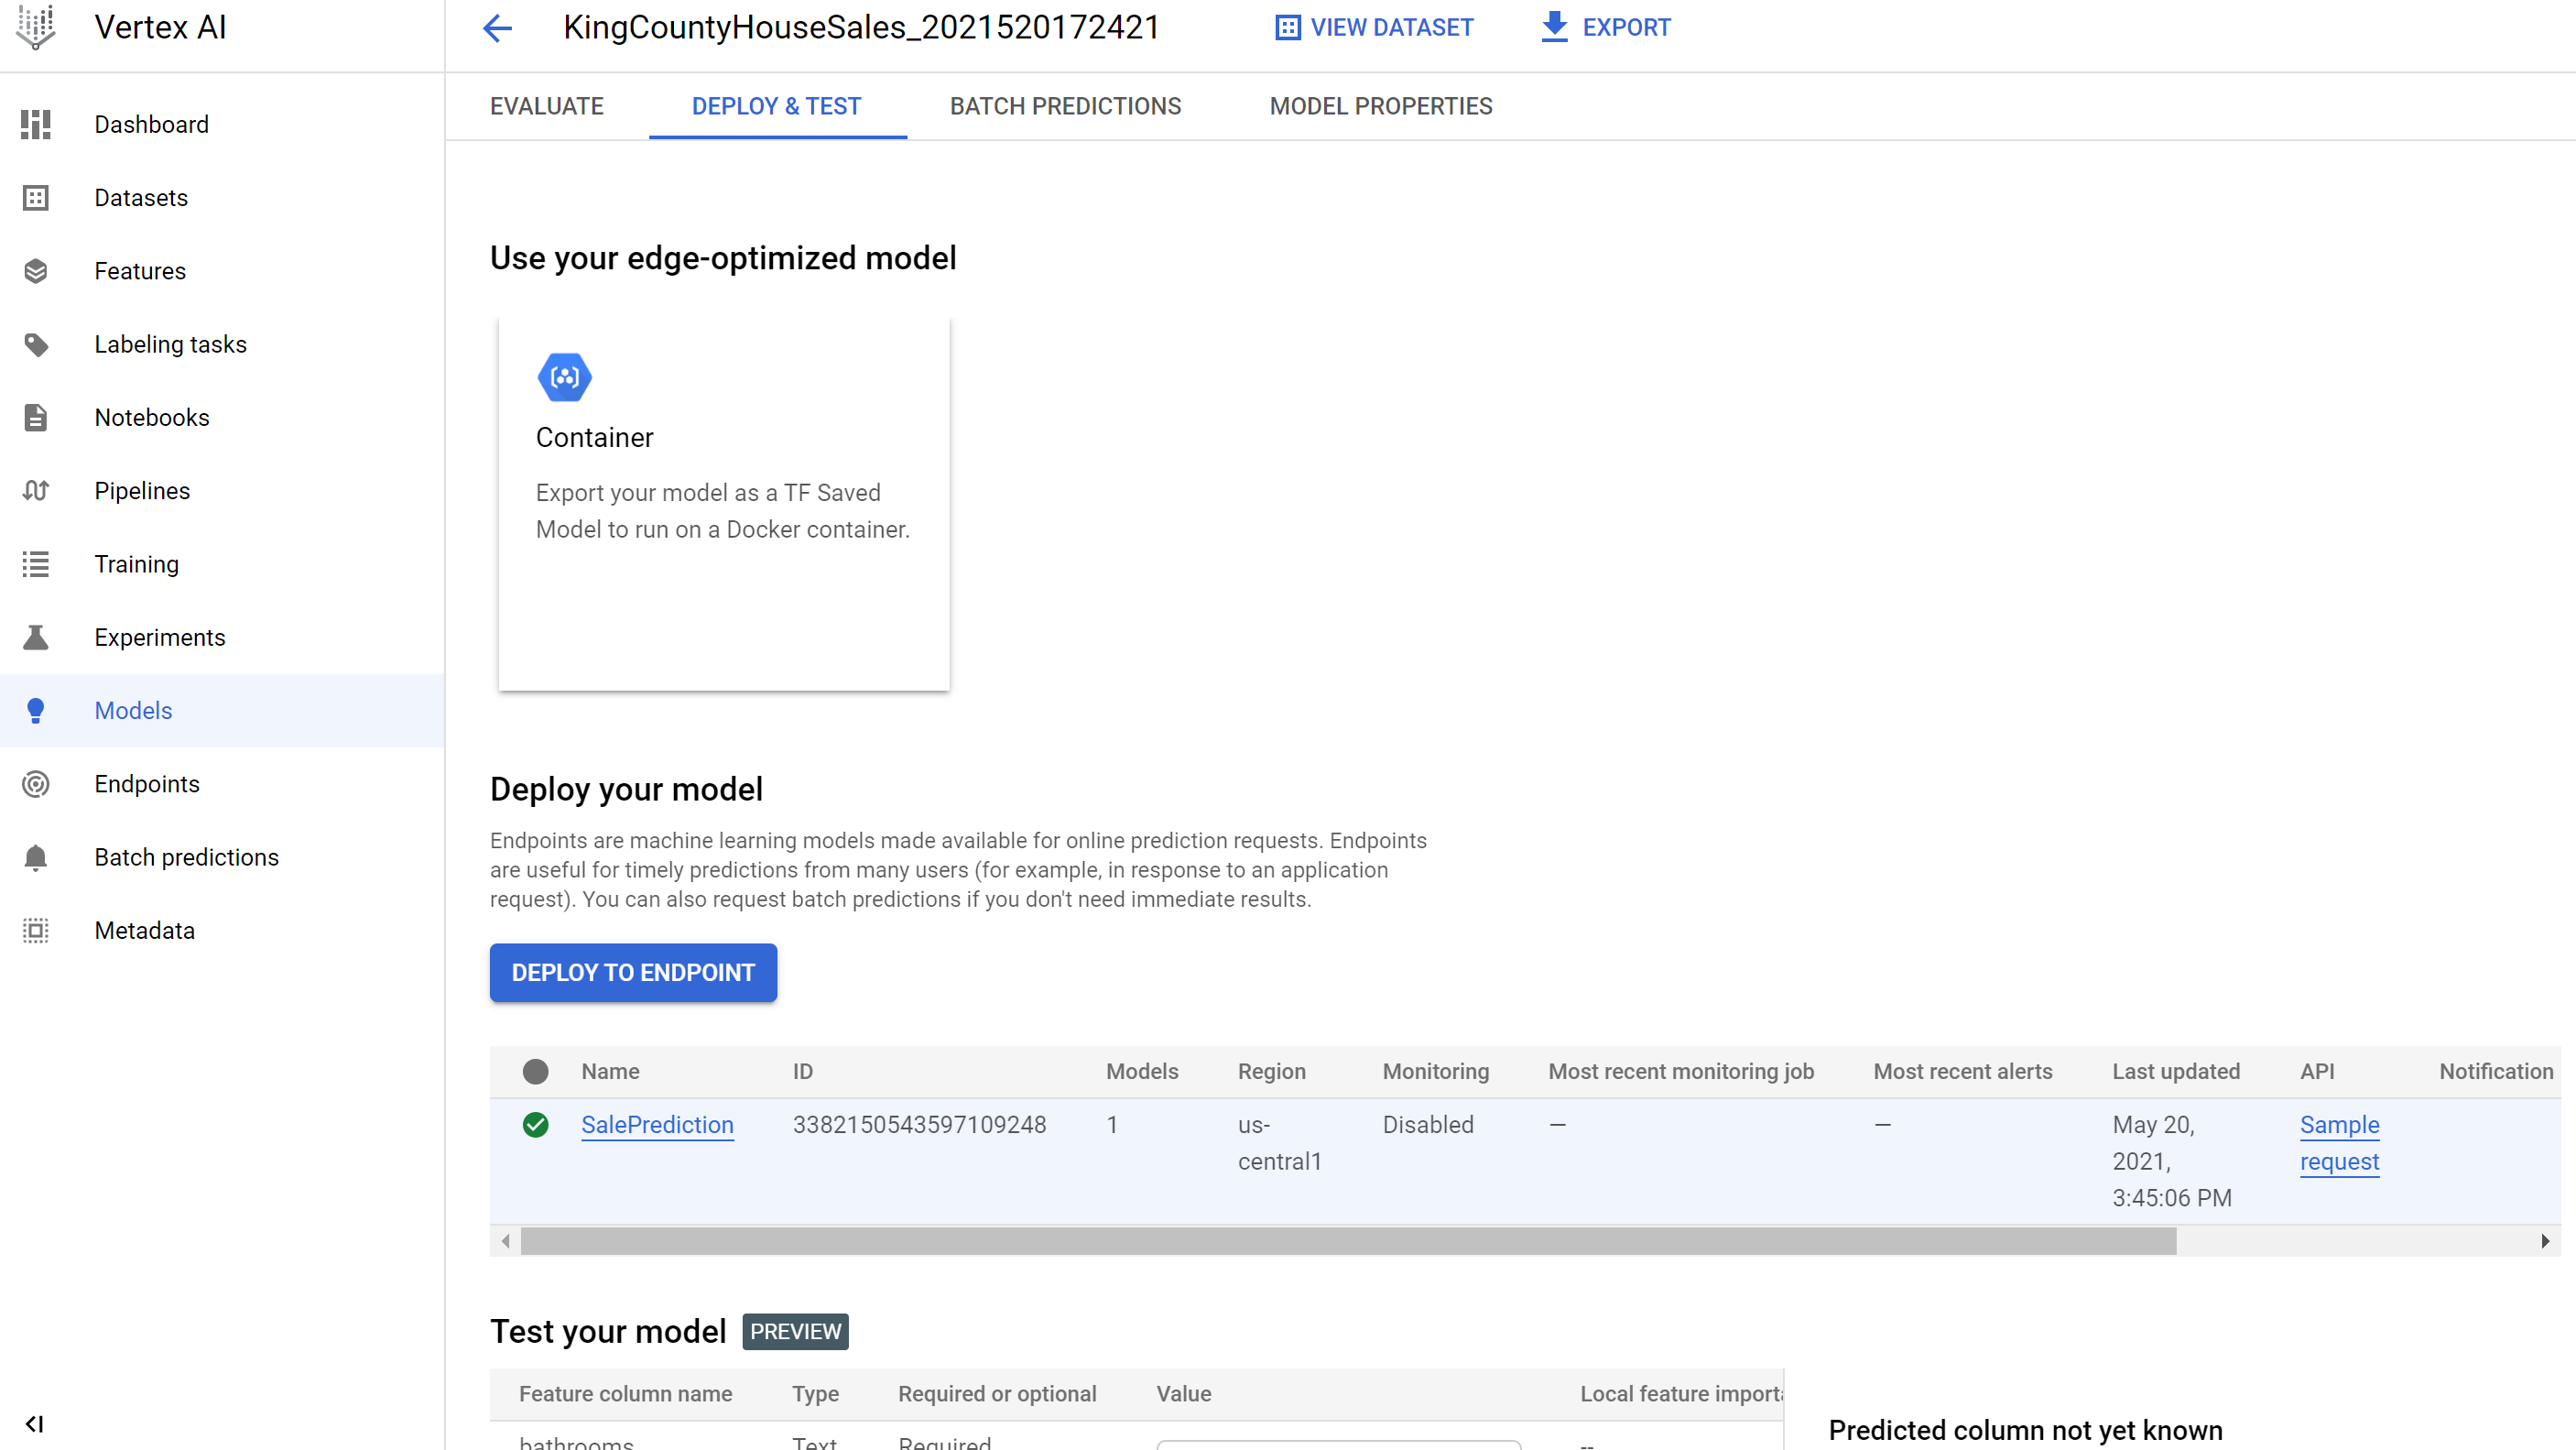
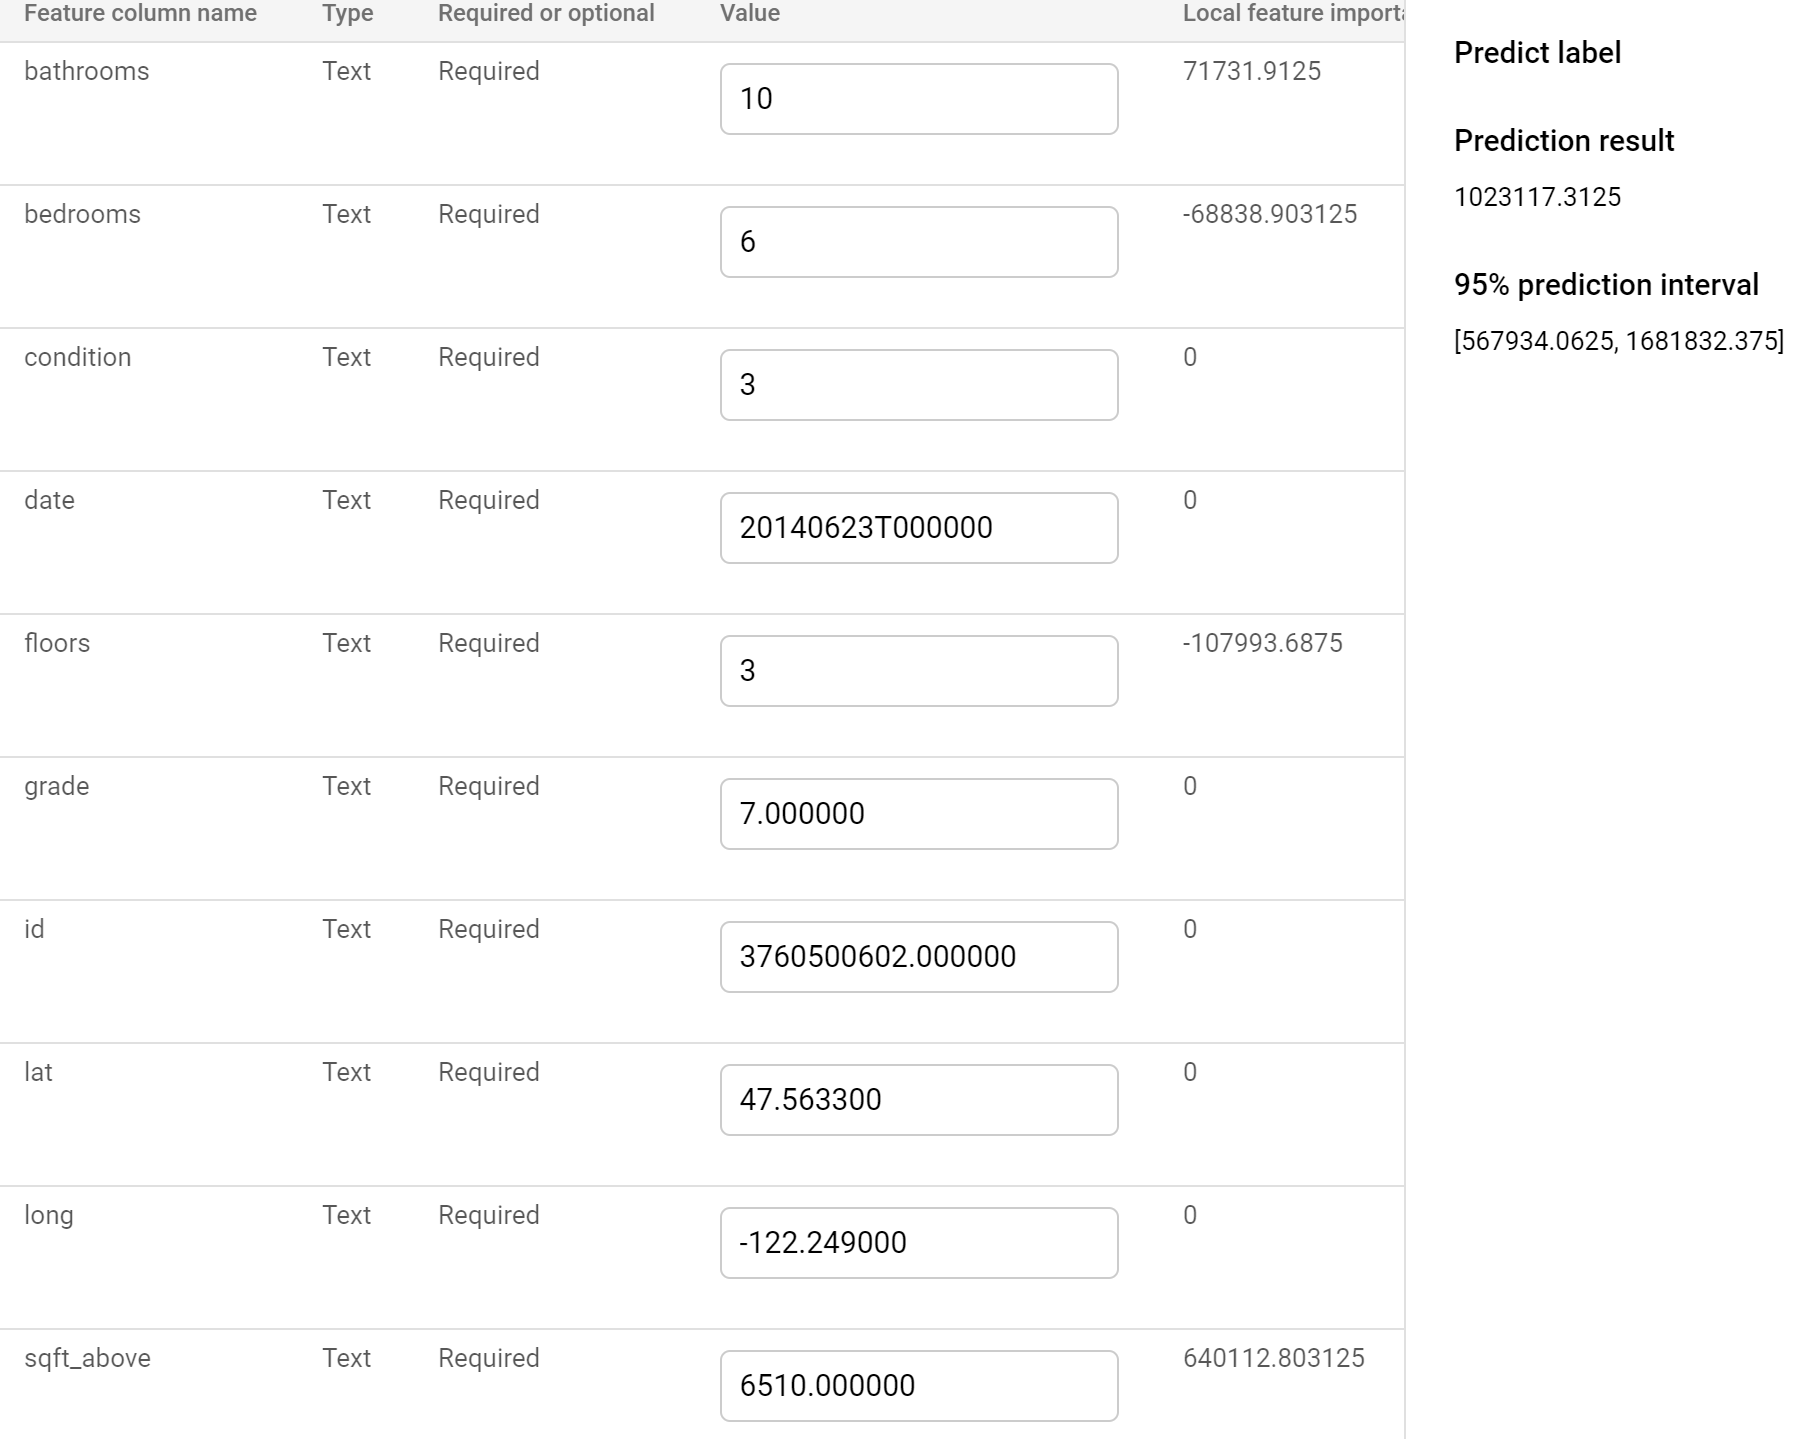
Scrolling down we’ll also see a Test your model section. This allows us to manually input numbers as if a new row were created in the file. We provide information describing house data, then hit PREDICT to determing our predicted house sale price.
I provided data that simulated a really nice house, which would be very expensive in the King County area. You can see on the right my predicted sale price is 1,023,117, with a 95% confidence interval of 567,934 to 1,681,832. Thats quite a range. Try changing the values a bit and see how your model’s confidence interval changes. More reasonable/common house information seems to reduce the span.
Wrapping Up
Hopefully you found this quick introduction to Vertex AI to be fun and insightful. This is a very powerful platform and we only explored a very small subset with a simple example. We also used AutoML, but models can be developed and deployed from Vertex AI as well.
Ultimately, the ability to take the MLops cycle from start to finish, while providing options for very minimal input and knowledge, helps to push the democratization of data science and machine learning to the next level.
If you have any questions, comments, or just want to chat, please reach out!