Basics of Graph Databases - Part 1
Table of Contents
This is Part 1 of 2. Part 2 will be focused on deploying/configuring and building/querying a graph database in Neo4j on Microsoft Azure.
From recommending new friends or contacts to you on Facebook or LinkedIn, to detecting fraudulent activity on your credit card and providing targeted advertisements, graph databases are everywhere and are increasing in popularity. Graph databases support the mentality that the relationships between data are just as important as the data itself.
One might ask - “why graph databases?”. Great question! There are many reasons to explore using a graph database over traditional relational database management systems (RDBMS). I would encourage you to do the research yourself, as we’re not looking to compare/contrast in this article. With that being said, a very short “pros” list below:
- Schema-less design provides benefits found in Document Databases while supporting a relationship-based model commonly found in Relational Databases.
- Graph relationships exist within storage and queries “follow” the directional relationships. This helps remedy the expensive resource needs to perform complex index lookups and joins of relational databases.
- Complex queries can be done with significantly fewer lines of code, and returned in much faster times compared to relational databases. Click this link for an example of execution times between MySQL and Neo4j.
Disclaimer: **There is also a lot of information on Graph DBs available and I would suggest taking topics from this article that you may find interesting and digging deeper. This is not intended to be all-encompassing.
Graph Database Types
Graph databases themselves come in a few different “flavors”:
- Property Graph
- Hypergraph
- Triple Store
For the sake of this article we’ll be focusing on the Property Graph type. Some of the more popular graph solutions such as Neo4j, AWS Neptune, and Azure CosmosDB all work off the Property Graph structure. Microsoft online services also have the Microsoft Graph API that you can query!
Property Graph Overview
Depending on who you talk to you’ll hear that Property Graphs work on the concept of Nodes (Vertices), Relationships (Edges), and Constraints. For simplicity sake we’ll stick with the terminology of Nodes and Relationships, as it’ll make most sense when relating to common applications.
Nodes commonly represent a thing of some sort. This can be a person (such as your friends or connections), a vehicle, a disease type, etc. Nodes have the ability to have Labels attached to them.
Think of labels as a form of metadata that describes the node. For example, a node for “United States” might have a label called “Country”, where a node for “Ben Prescott” might have a label for “Person”. Below is an example of the continent of Europe (node) with a label of “Continent”.

Relationships are what tell the story between two or more nodes. Each relationship that exists between a set of nodes has a single type, has a relational direction associated with it, and is usually descript enough to understand. As an example, if my node is Ben Prescott I might have a relationship of type “Writes” with another node that represents this LinkedIn article. A manager might have a relationship type of “Manages” with all their employees being the individual nodes, where-as each individual employee might have a “ReportsTo” relationship type with their manager.
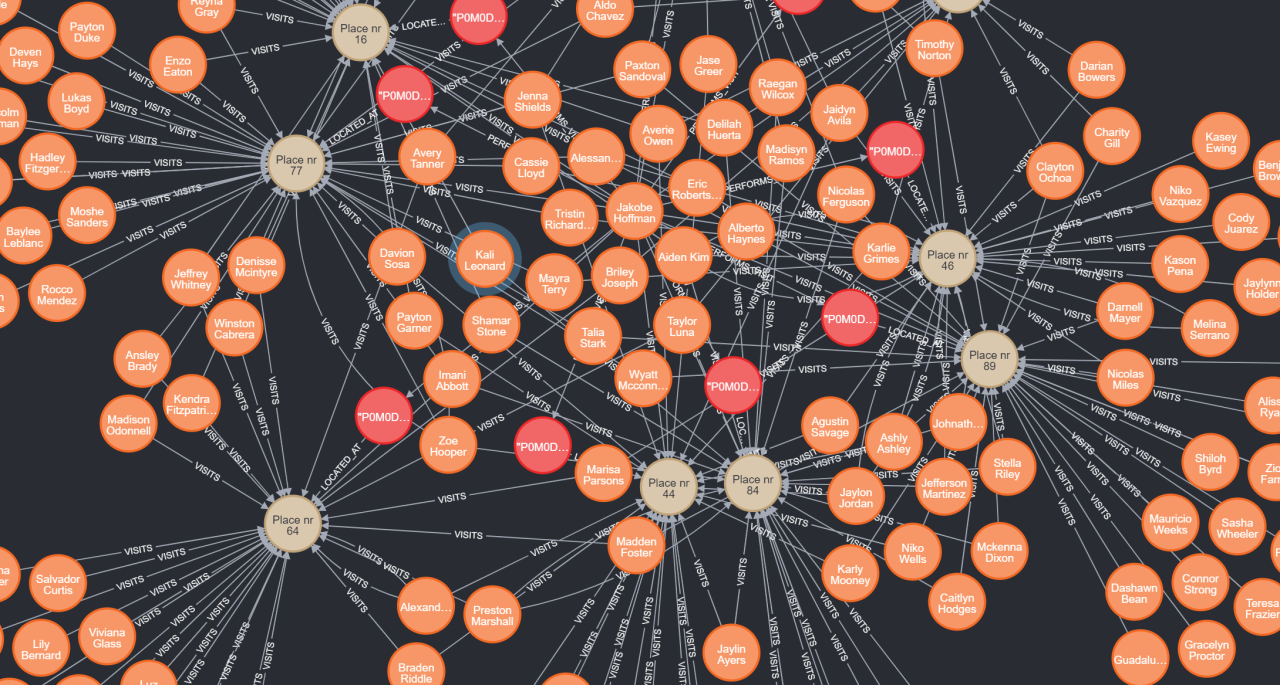
In our example data below, we can see many Person nodes who have a relationship type of Visits with another node of type Place. You can also see the arrows describing the direction of the relationship. After all, the Place wouldn’t Visitthe Person, right? :) The last piece to quickly touch on is a Constraint.

Constraints are introduced as a means of ensuring conformity within the graph as new nodes, labels, relationships etc. are introduced. In the common example of social media, the Person node might always require both a first and last name.
You also have the ability to ensure that new additions to the graph are unique and don’t have conflicts. For example, two different Person nodes wouldn’t have the same Social Security Number, so the graph can ensure these conflicts don’t exists.
Graph Query Languages
Different graph database systems have different query languages, but two of the most popular are Cypher and Gremlin. Many can argue that if you know one you can easily learn the other. It is also useful to have an understanding of SQL, as you can relate a lot of the query syntax and statements from SQL to graph queries. For the purpose of this article we’ll be focusing on Cypher, which is Neo4j’s specific query language.
Intro to Cypher
As stated earlier, Cypher is Neo4j’s specific graph query language and is arguably one of the easiest to grasp. Something to keep in mind in this section is that traversing a graph is like finding yourself at a fork in the road, where each path leads you down a different relationship to another node.
Cypher is written in a way that actually helps visualize what you’re looking to return from the graph, as it actually involves arrows to tell the direction, Lets take a look at quick Cypher command and it’s result.

Pretty simple right? You can already likely piece together what the query is saying. In this case we’re looking to return any person who visits any place. Similarly to SQL’s “SELECT” statement, Cypher uses “MATCH”. Lets take a look at another example, this time using a graph for network and IT device management.
In true graph nature you’ll see why such a large emphasis is placed on the relationships. I’ll make this progressive so it’ll be more fun and can build on our query.
1.Get all Datacenters within the org

2. Plus… find all Racks within the Datacenter

3. Plus… find Machines (servers) within the Racks
Results were limited to reduce result spread (see query)

4. Plus… find all Applications running on the Machines (servers)

Conclusion:
While there is a LOT more to be discussed, hopefully you found this brief introduction useful and maybe even piqued your interest in exploring graph databases. In the next part we’ll be deploying a Neo4j instance on Azure, loading some test data, and going deeper into queries to include new statements and finding more insight in our data. As with any technology, evaluation against the needs of the business will need to be completed to determine the best route. Each database structure has its place!
If you have any questions or general discussion topics, please post them in the comments. I would love to hear from you!