Project Crashing - A Prescriptive Analytics Approach
Table of Contents
Have you been involved in a project that requires a shortened timeline? It isn’t uncommon for project deadlines to be imposed after a project kickoff occurs, or to attempt to accelerate a project for any number of reasons.
Different situations require Project Management to evaluate the project tasks and schedule to determine where or how an overall project can be shortened, requiring manual adjustments and a sprinkle of intuition.
Disclaimer: Everything modeled in this post is fictional. No real data or project examples were used.
Introduction & Motivation
Having just spent the past three months focusing heavily on prescriptive analytics and building a number of optimization algorithms, I decided to write about a specific project I worked on that provided an analytical approach to solving what is known as project crashing.
A shift or addition to project resources happens all the time. However, many decisions are made quickly and are based on intuition. I wanted to find a way to solve some of these problems using mathematical algorithms, rather than best guesses.
This approach uses a Mixed-integer Programming method and is solved using commercial software called Gurobi and Python.
Understanding Project Crashing
The purpose behind project crashing, or “crashing a project”, is to shorten the overall project duration. This could be to hit a client imposed deadline, to keep project delivery times to a minimum, or to ensure we can free up resources as fast as possible for the next project.
Project crashing can be an exercise in itself, as tasks need to be evaluated to see if they can even be shortened/crashed, by how long, and what the impact to the project budget or internal costs are by shortening said tasks.
There may be a few creative ways to shorten a task, including asking a client to support the effort, to add additional project resources to help speed up delivery, or to burn additional hours each day. An increase in internal costs is likely to occur with the either of the three mentioned options.
Introduction to Linear Optimization
Linear Optimization, or sometimes called Linear Programming (“LP”), is a term used to describe a mathematical model that uses linear functions to optimize a problem’s solution.
LP models are typically made up of an Objective Function, one or more Constraints, and Decision Variables. Common goals of LP models are to Maximize or Minimize the objective function. The decision variables are the values you want to find within the objective function that meet the minimization or maximization criteria, where-as the constraints provide “rules” that the model must follow while finding the right solution.
Let’s take a look at a short LP model…
Background
We’ll suppose a fake company creates pants and shirts…
In order to make these they have the material polyester and cotton. They have 2000 units of polyester available and 700 units of cotton.
Each pair of pants requires 2 units of polyester and 2 units of cotton.
Each shirt requires 1 unit of polyester and 2.5 units of cotton.
They sell a pair of pants at 30 dollars and a shirt at 20 dollars.
The below objective function, \(Z\), represents the sales revenue of pants and shirts. The company wants to maximize their revenue.
Objective Function
MAXIMIZE:
[Z = 30x + 20y]
Decision Variables
the number of pants
[x]
the number of shirts
[y]
Constraints
polyester used for both pants and shirts needs to be less than the max available, 2000
[2x + y <= 2000]
cotton used for both pants and shirts needs to be less than the max available, 700
[2x + 2.5 <= 700]
ensures that values obtained for x and y are natural numbers, as you can’t have negative pants/shirts. :)
[x >= 0, y >= 0]
Now that we have our model formulation, we can easily plug this info into Python and solve using Gurobi. I won’t be going deep into Gurobi here, but heres a snippet:
import gurobipy as gp
from gurobipy import GRB

# Create a new model
m = gp.Model("ClothesSales")

# Create variables
x = m.addVar(vtype=GRB.INTEGER, name="x")
y = m.addVar(vtype=GRB.INTEGER, name="y")

# Set objective
m.setObjective(30*x + 20*y, GRB.MAXIMIZE)

# Set constraints
m.addConstr(2*x + y <= 600, "polyester constraint")
m.addConstr(2*x + 2.5*y <= 700, "cotton constraint")
m.addConstr(x >= 0, "x non-negativity constraint")
m.addConstr(y >= 0, "y non-negativity constraint")

#Run the model
m.optimize()

#Print the solution's variable values
for v in m.getVars():
  print('%s %g' % (v.varName, v.x))

#Print the objective function value
print('Obj: %g' % m.objVal)
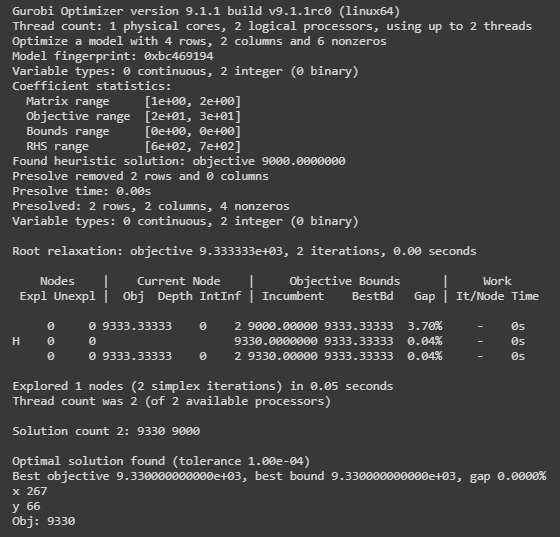
The output of our model is shown below. We can see at the end that we’ll achieve a maximum revenue of $9,330 by creating 267 pairs of jeans and 66 shirts, while ensuring the solution meets all of the given constrains.
Alright… back to project crashing!
Preparation & Approach
Before we move too deep, lets mock something up quickly in Excel.
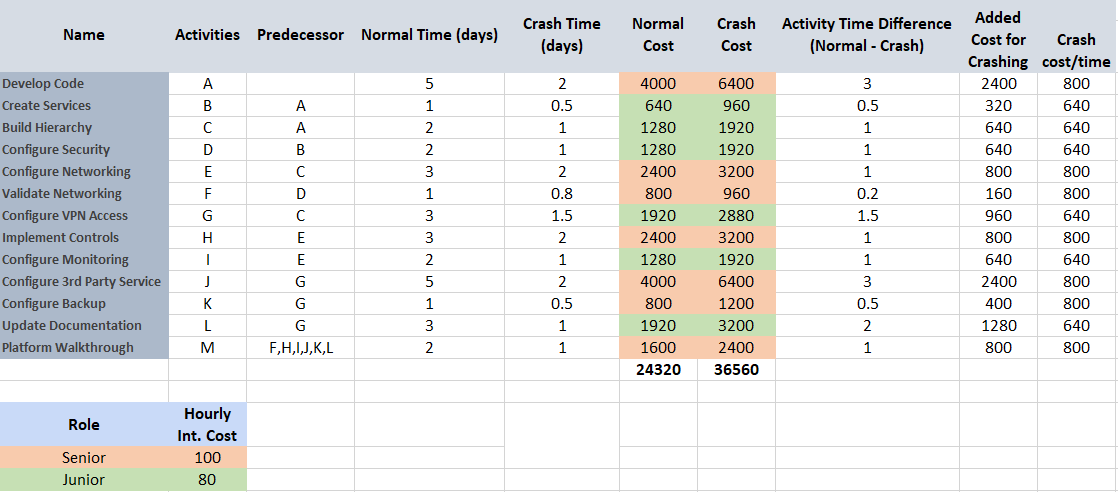
The below screenshot shows an example project’s task crash plan. We can see the following information, from left to right:
- Task names
- Letter assigned to tasks (used in the PERT chart later)
- Task dependencies or predecessors
- Standard duration of a task
- Estimated days the task could be crashed
- Standard project cost
- Project cost if crashed
- The new task duration if crashed
- How much cost is added by crashing the project
- The cost of crashing per time unit
At the bottom you’ll also see I’ve color-coded the two project resource, a senior and junior, as well as a made up internal cost per hour. The color-coded tasks represent which resource is responsible for it.
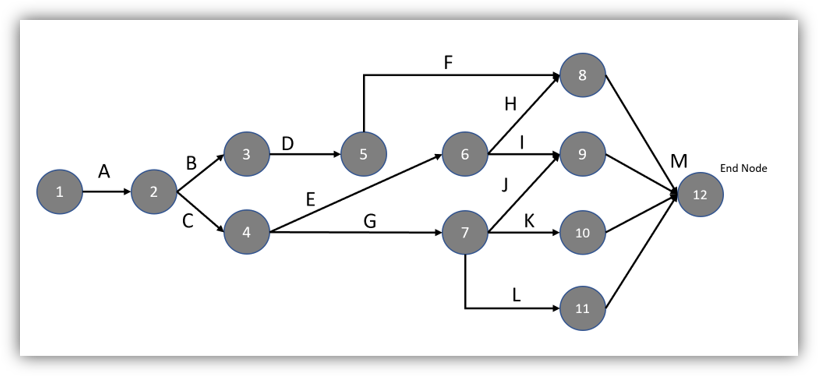
Part of the crashing effort may involve creating a Program Evaluation Review Technique (PERT) chart. PERT charts provide a visualization of the project’s timeline, with different tasks associated with the project and their dependencies. PERT charts may also provide additional information, such as the duration of each task and the effort from the different project resources.
We can now create a PERT chart from this information. There is plenty of information online on how to create a PERT chart, but it can follow information from the spreadsheet and just models the project visually.

From here we can create our model formulation. This gets a bit complex, so bear with me!
Model Formulation & Code
Now that we have our PERT chart and our project costs/durations laid out, we can create our mathematical formulation and write some code to solve it.
To help keep this post a bit shorter, I’m not going to be diving into the mapping of each task to the model. If you’re interested in understanding more, please read this paper.
Using the scenario of shortening a project to hit a deadline, we’ll start by defining our objective function, which aims at minimizing the project crash costs. I.e., we want to hit the deadline while keeping added costs as low as possible.
Objective Function
MINIMIZE: \(\sum_{a=1}^n D_aC_a\)
Decision Variables
\(D_a\) number of days a specific task will be crashed
\(E_t\) when an event will occur within the project, based on the PERT
Constraints
\(D_a <=\) maximum crash potential for a specific task
\(E_t >= n - D_a + E_{t-1}\) defines the duration of each tasks in relation to it’s previous dependent tasks’s occurent in the project
\(E_{12} <=\) project deadline requirement (in days)
\(E_1 = 0\) states the first task has an occurence of zero, as it is just starting the project
Now that we have our mathematical formulation we can move into writing this in Python. Below is the Python code for this problem, using Gurobi, and with some comments for clarification purposes. Long code snippet incoming…
# Create a new model
m = gp.Model("ProjectCrash")

# Create variables for the potential crash durations
Y1 = m.addVar(vtype=GRB.INTEGER, name="Y1")
Y2 = m.addVar(vtype=GRB.INTEGER, name="Y2")
Y3 = m.addVar(vtype=GRB.INTEGER, name="Y3")
Y4 = m.addVar(vtype=GRB.INTEGER, name="Y4")
Y5 = m.addVar(vtype=GRB.INTEGER, name="Y5")
Y6 = m.addVar(vtype=GRB.INTEGER, name="Y6")
Y7 = m.addVar(vtype=GRB.INTEGER, name="Y7")
Y8 = m.addVar(vtype=GRB.INTEGER, name="Y8")
Y9 = m.addVar(vtype=GRB.INTEGER, name="Y9")
Y10 = m.addVar(vtype=GRB.INTEGER, name="Y10")
Y11 = m.addVar(vtype=GRB.INTEGER, name="Y11")
Y12 = m.addVar(vtype=GRB.INTEGER, name="Y12")
Y13 = m.addVar(vtype=GRB.INTEGER, name="Y13")

#Create variables for task durations
X1 = m.addVar(vtype=GRB.INTEGER, name="X1")
X2 = m.addVar(vtype=GRB.INTEGER, name="X2")
X3 = m.addVar(vtype=GRB.INTEGER, name="X3")
X4 = m.addVar(vtype=GRB.INTEGER, name="X4")
X5 = m.addVar(vtype=GRB.INTEGER, name="X5")
X6 = m.addVar(vtype=GRB.INTEGER, name="X6")
X7 = m.addVar(vtype=GRB.INTEGER, name="X7")
X8 = m.addVar(vtype=GRB.INTEGER, name="X8")
X9 = m.addVar(vtype=GRB.INTEGER, name="X9")
X10 = m.addVar(vtype=GRB.INTEGER, name="X10")
X11 = m.addVar(vtype=GRB.INTEGER, name="X11")
X12 = m.addVar(vtype=GRB.INTEGER, name="X12")

# Set objective function.
# The static numbers were determined from the spreadsheet "Crash cost/time" column.
# We're trying to minimize the output of this function.
m.setObjective(800*Y1 + 640*Y2 + 640*Y3 + 640*Y4 + 800*Y5 +
                800*Y6 + 640*Y7 + 800*Y8 + 640*Y9 + 800*Y10 +
                800*Y11 + 640*Y12 + 800*Y13, GRB.MINIMIZE)

#Crash potentials (days) for eask task - from the spreadsheet
m.addConstr(Y1 <= 2, "c0") #A
m.addConstr(Y2 <= .5, "c1") #B
m.addConstr(Y3 <= 1, "c2") #C
m.addConstr(Y4 <= 1, "c3") #D
m.addConstr(Y5 <= 2, "c4") #E
m.addConstr(Y6 <= .8, "c5") #F
m.addConstr(Y7 <= 1.5, "c6") #G
m.addConstr(Y8 <= 2, "c7") #H
m.addConstr(Y9 <= 1, "c8") #I
m.addConstr(Y10 <= 2, "c9") #J
m.addConstr(Y11 <= .5, "c10") #K
m.addConstr(Y12 <= 1, "c11") #L
m.addConstr(Y13 <= 1, "c12") #M

# Duration of each task in relation to previous dependent task's occurence
# This part takes a bit to map out. For more information refer to the linked paper in the blog
m.addConstr(X1 == 0, "c14") #START (#1)
m.addConstr(X2 >= 5 - Y1 + X1, "c15") #2
m.addConstr(X3 >= 1 - Y2 + X2, "c16") #3
m.addConstr(X4 >= 2 - Y3 + X2, "c17") #4
m.addConstr(X5 >= 2 - Y4 + X3, "c18") #5
m.addConstr(X6 >= 3 - Y5 + X4, "c19") #6
m.addConstr(X7 >= 3 - Y7 + X4, "c21") #7
m.addConstr(X8 >= 1 - Y6 + X5, "c22") #8
m.addConstr(X8 >= 3 - Y8 + X6, "c23") #8
m.addConstr(X9 >= 2 - Y9 + X6, "c24") #9
m.addConstr(X9 >= 5 - Y10 + X7, "c25") #9
m.addConstr(X10 >= 1 - Y11 + X7, "c26") #10
m.addConstr(X11 >= 5 - Y12 + X7, "c27") #11
m.addConstr(X12 >= 2 - Y13 + X8, "c28") #12
m.addConstr(X12 >= 2 - Y13 + X9, "c29") #12
m.addConstr(X12 >= 2 - Y13 + X10, "c30") #12
m.addConstr(X12 >= 2 - Y13 + X11, "c31") #12

# Necessary project duration. What it needs to be shortened to (in days) to hit the deadline.
# This represents a necessary project duration of 11 days
m.addConstr(X12 <= 11, "c32")

# This is our non-negativity constraint. We can't have negative days.
# Creating a for loop for each variable that needs a non-negativity constraint.
xlist = [X1,X2,X3,X4,X5,X6,X7,X8,X9,X10,X11,X12,Y1,Y2,Y3,Y4,Y5,Y6,Y7,Y8,Y9,Y10,Y11,Y12,Y13]
for x in xlist:
  m.addConstr(x >= 0)

# Run the model optimization
m.optimize()

# Return the variable values
for v in m.getVars():
    print('%s %g' % (v.varName, v.x))

# Return the result of our objective function
print('Obj: %g' % m.objVal)
Interpreting The Results
After running this model we’ll be presented with the following output:
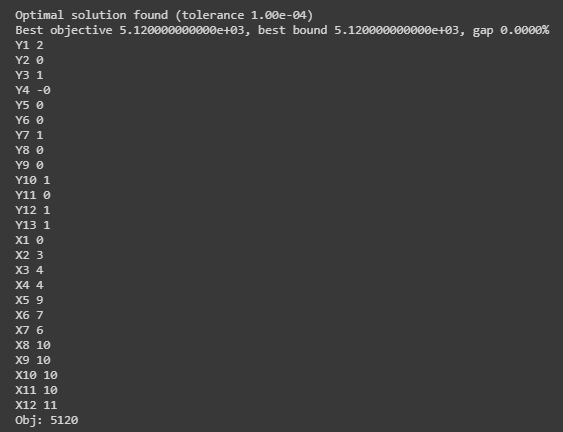
This provides us with a few pieces of information. The Y variables we defined represent the number of days to crash a task. This is ultimately the prescriptive part of this model. Essentially, it is telling us to crash task 1 by 2 days, crash task 3 by 1 day, task 7 by 1 day, etc.
We can also see that our last dependent task, represented by X12, shows a project duration of 11 days, which is the deadline we defined in our code.
Our model found a recommended method that not only hits our deadline of 11 days, but also keeps the additional crash cost to a minimum, adding $5,120 to the overall project cost.
Feel free to drop me an email or reach me on LinkedIn if you have any questions/comments!